AI ROI: How to Measure It (With Benchmarks From 250 Case Studies)
How to measure AI ROI: the formula with a worked example, hard vs soft returns, metrics by use case, benchmarks from 250 enterprise AI case studies and 150 agent deployments, a 5-step measurement framework and common mistakes.

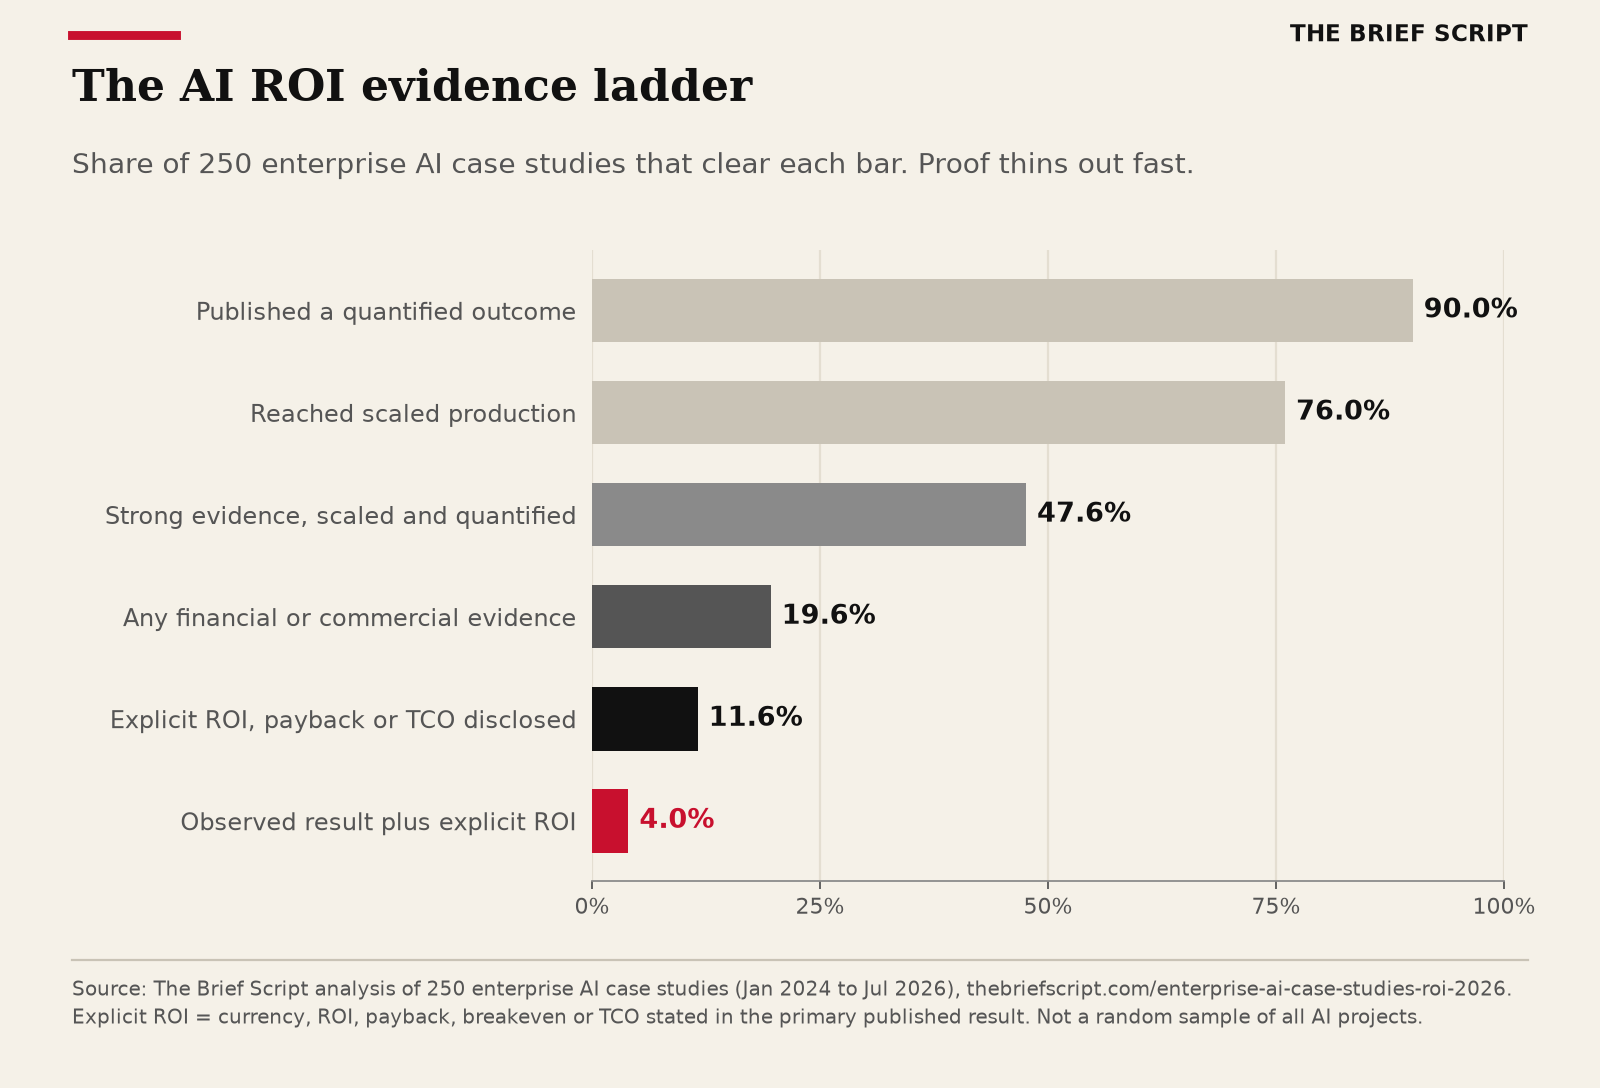
AI ROI is the net financial return from an AI system divided by its total cost: (benefit − cost) ÷ cost × 100. Count only hard benefits you can attribute, such as cost removed, revenue added or losses avoided. In our review of 250 enterprise AI case studies, only 11.6% disclosed an explicit ROI figure.
That gap is the real story. Most companies can show that AI changed how work gets done. Far fewer can show where the money went. This guide gives you the formula, a worked example, the metrics to track by use case and benchmarks from our own data, so your number holds up when finance reviews it.
The AI ROI formula
The arithmetic is simple. The discipline is in what you put on each line.
| Measure | Formula | What belongs in it |
|---|---|---|
| AI ROI (%) | (Attributable benefit − Total cost) ÷ Total cost × 100 | Cost removed, incremental revenue, losses avoided |
| Payback period | One-time cost ÷ Monthly net benefit | Integration, data prep, training, change management |
| Total cost of ownership | Licenses + inference + integration + human review + operations | The people who check and correct model output |
Inference is the line teams most often guess at. Price it from real token volumes with our AI token counter and current model rates in the AI API Price Index.
Worked example: a customer-support AI assistant
All inputs below are illustrative assumptions for a 40-agent support team, not data from a real deployment.
Costs (assumed)
- Platform licenses: $90,000 a year
- Inference and API usage: $24,000 a year
- Human review of AI answers (0.5 FTE): $40,000 a year
- Integration and data preparation: $80,000, one time
- Training and change management: $26,000, one time
Year-one cost is $260,000: $154,000 recurring plus $106,000 one time.
Hard benefits (assumed)
- 25% of 120,000 yearly contacts deflected from an outsourced queue at $6 each: $180,000
- Two roles not backfilled after normal attrition at $55,000 loaded cost each: $110,000
Hard benefit is $290,000 a year.
Results
- Year-one ROI: ($290,000 − $260,000) ÷ $260,000 = 11.5%
- Year-two ROI, once one-time costs drop off: ($290,000 − $154,000) ÷ $154,000 = 88%
- Payback: $106,000 ÷ ($136,000 ÷ 12) = about 9.4 months
Now the trap. Suppose each agent also saves 30 minutes a day. At $35 an hour over 230 workdays, that is $161,000 of time. Add it to the benefit line and year-one ROI jumps from 11.5% to 74%. Nothing about the business changed except the spreadsheet. Keep that $161,000 in a separate soft-returns column until you can show what the freed time produced.
Hard vs. soft returns
Hard returns show up in the P&L: lower vendor or outsourcing spend, roles not backfilled, fewer chargebacks or penalties, incremental revenue you can attribute, and losses avoided, such as fraud caught.
Soft returns are real but not yet cash: hours saved, faster cycle times, higher quality scores, better employee experience and more customer satisfaction. They matter, and they often lead to hard returns. But they belong in a separate column until you can show the conversion.
Soft returns turn hard through a decision someone makes. A support team that resolves tickets faster can absorb volume growth without hiring, cut overtime or end an outsourcing contract early. A finance team that closes the books two days sooner can drop contractor hours at quarter end. If nobody makes that decision, the time gets absorbed into other work and the return never reaches the P&L. Name the decision, its owner and its date when you approve the project.
Our dataset applies this rule strictly. “250,000 hours saved” stays non-financial unless the company ties it to money. Pipeline is a commercial signal, not revenue. A projected saving is a business case, not a return.
Which AI ROI metrics to track by use case
The best-documented deployments in our study each measure a concrete unit of work against a baseline.
| Use case | Metrics to track | Example from our dataset |
|---|---|---|
| Customer service | Handle time, Tier 1 resolution, cost per contact, NPS | Chime: 18-second cut in handle time, est. $700,000 a year in efficiency gains |
| Software and IT | Cycle time, defects, code modernized, incidents closed | Thomson Reuters: 1.5 million lines modernized a month, costs down 30% |
| Marketing and sales | Conversion, cost per asset, attributable revenue | Salesforce: lead conversion up 1.8 times, linked to a $20 million pipeline lift |
| Operations | Energy cost, penalties, inspection time | ABB: intraday penalties down 80%, ROI within one year |
| Knowledge work | Hours saved, then what the time was used for | Lloyds: 46 minutes a day saved, per an internal survey |
| Healthcare | Error rates against a comparison group | Penda Health: 16% fewer diagnostic errors across 39,849 visits |
AI ROI benchmarks from 250 case studies
We scored 250 enterprise AI cases published between January 2024 and July 2026 for evidence quality and financial disclosure. The full method and case index are in our enterprise AI case studies report. Three benchmarks matter most for measurement:
- Only 11.6% of cases (29) disclosed explicit ROI, payback, breakeven or TCO, even though 76% were in scaled production. Just 4% (10 cases) paired an observed result with an explicit ROI figure.
- Where payback is reported, it is fast, but rare. IG Group reported payback in under three months. Quilter reported reaching its technology breakeven in one month. ABB reported ROI within one year. Treat these as best cases, not norms.
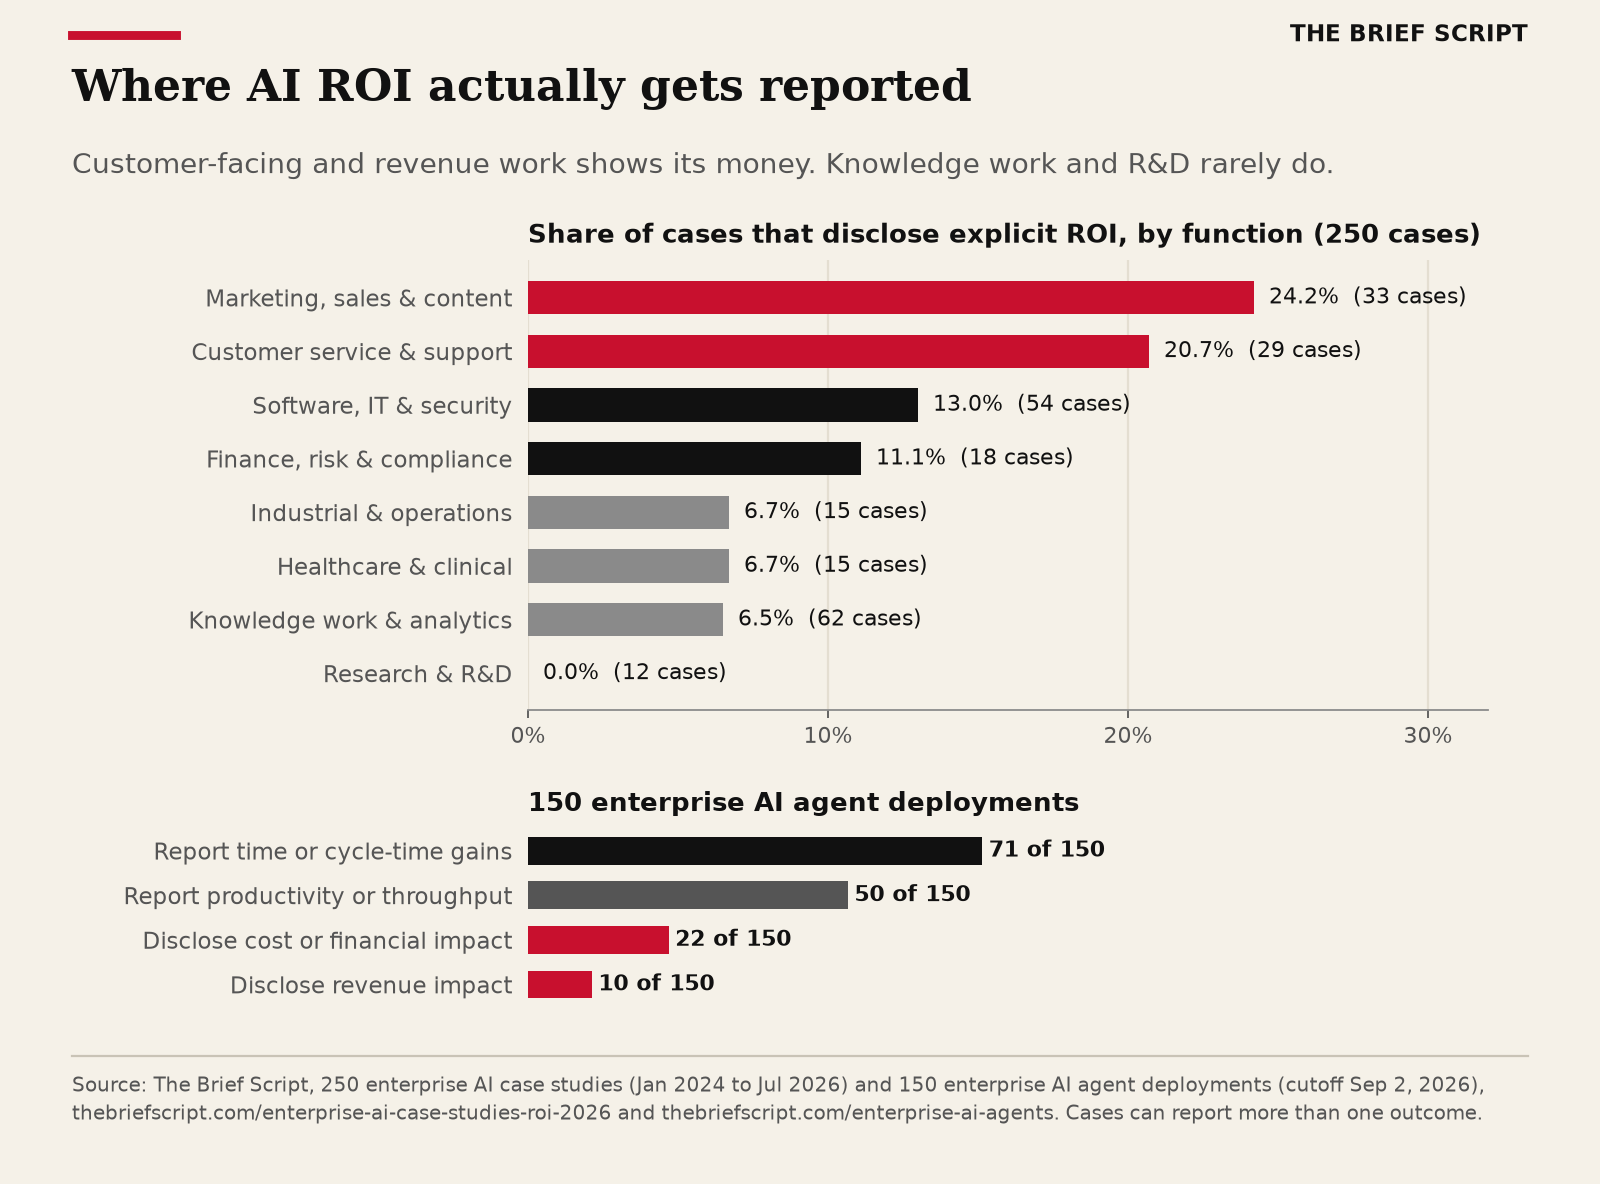
- Disclosure depends on the function. Explicit ROI appeared in 24.2% of marketing and sales cases and 20.7% of customer service cases, but in only 6.5% of knowledge-work cases and none of the 12 R&D cases.
Our study of 150 enterprise AI agent deployments shows the same pattern. Seventy-one report time or cycle-time gains, while only 22 disclose cost or financial impact and 10 disclose revenue impact.
A realistic bar follows from this. A deployment with a strong, scaled, quantified operating result is already in roughly the top half of published evidence (47.6%). One that also shows an observed, monetized return is in roughly the top 4%.
Why most AI ROI goes unmeasured
External surveys point the same way as our data:
- MIT NANDA’s 2025 report found that “95% of organizations are getting zero return” from generative AI, with only 5% of integrated pilots extracting millions in value. It is labeled preliminary and rests on 52 interviews, 153 survey responses and a review of 300+ public initiatives (MIT NANDA).
- CEOs told IBM that only 25% of AI initiatives delivered the expected ROI, and only 16% scaled enterprise-wide (IBM).
- In McKinsey’s 2026 survey, 80% of respondents say AI improved their own productivity, but only 37% attribute any EBIT impact to it, flat from 2025 (McKinsey).
- Gartner expects over 40% of agentic AI projects to be canceled by the end of 2027, citing escalating costs, unclear business value or inadequate risk controls (Gartner).
The causes are mostly mechanical. Teams skip the baseline: 98.7% of Strong-evidence cases in our data disclosed one, against 75.5% of the rest. Benefits stay as hours that never convert into cost or revenue. Costs leave out human review and inference. And projects are judged too early, before the novelty period ends.
A 5-step AI ROI measurement framework
- Pick one unit of work and one owner. Cost per ticket, cycle time per claim or errors per 1,000 records, owned by the business leader who carries the budget.
- Record a baseline before rollout. Capture at least a few weeks of the metric, plus volume, so you can tell AI gains apart from seasonal swings. A holdout group is better still.
- Build the full cost line. Licenses, inference, integration, data work, human review, training and ongoing operations. If readiness is in doubt, run an AI readiness assessment first.
- Track hard and soft returns in separate columns. Write down in advance how a soft gain becomes hard: fewer contractors, avoided hires, more output per person, or revenue.
- Read operating results after a quarter, and ROI after a budget cycle. In our data, 93.4% of Strong-evidence cases disclosed their measurement period. Report ROI only once finance can see the effect.
Common AI ROI mistakes
- Treating adoption as ROI. Seats, prompts and active users show reach. The 19 adoption-only cases in our study averaged an evidence score of about 60.5, and none reached the Strong band.
- Multiplying hours saved by salary. Freed time is capacity, not cash.
- Reporting projections as results. In our data, 26.9% of projected cases cited a dollar figure, against 7.4% of observed ones.
- Counting pipeline as revenue. Only incremental, attributable revenue counts.
- Leaving out inference and review costs. Both grow with usage, so a pilot’s cost line understates production.
FAQ
How do you calculate AI ROI?
Subtract total cost from attributable benefit, divide by total cost and multiply by 100. Total cost includes licenses, inference, integration, data work, human review and operations. Benefit includes only cost removed, revenue added or losses avoided.
What is a good AI ROI benchmark?
There is no reliable industry-wide percentage, because so few companies publish one. Only 11.6% of the 250 cases we reviewed disclosed explicit ROI. A strong, scaled, quantified operating result puts you in roughly the top half of published evidence.
How long does it take to see ROI from AI?
The fastest published paybacks in our dataset took one to three months, and ABB reported ROI within a year. Plan to read operating metrics after at least a quarter and make financial claims after a full budget cycle.
Should hours saved count toward AI ROI?
Not on their own. Track them as a soft return, and move them into ROI only when they show up as lower cost, avoided hiring, more output or more revenue.