AI-Proof Jobs 2026: We Scored 813 Occupations on AI Exposure
We scored 813 US occupations on AI exposure, real AI use and projected growth. Hands-on care and skilled trades are the most AI-proof jobs; language, writing, data and phone work are the most exposed. 38.4 million workers are in high-exposure jobs, but exposure is not job loss.

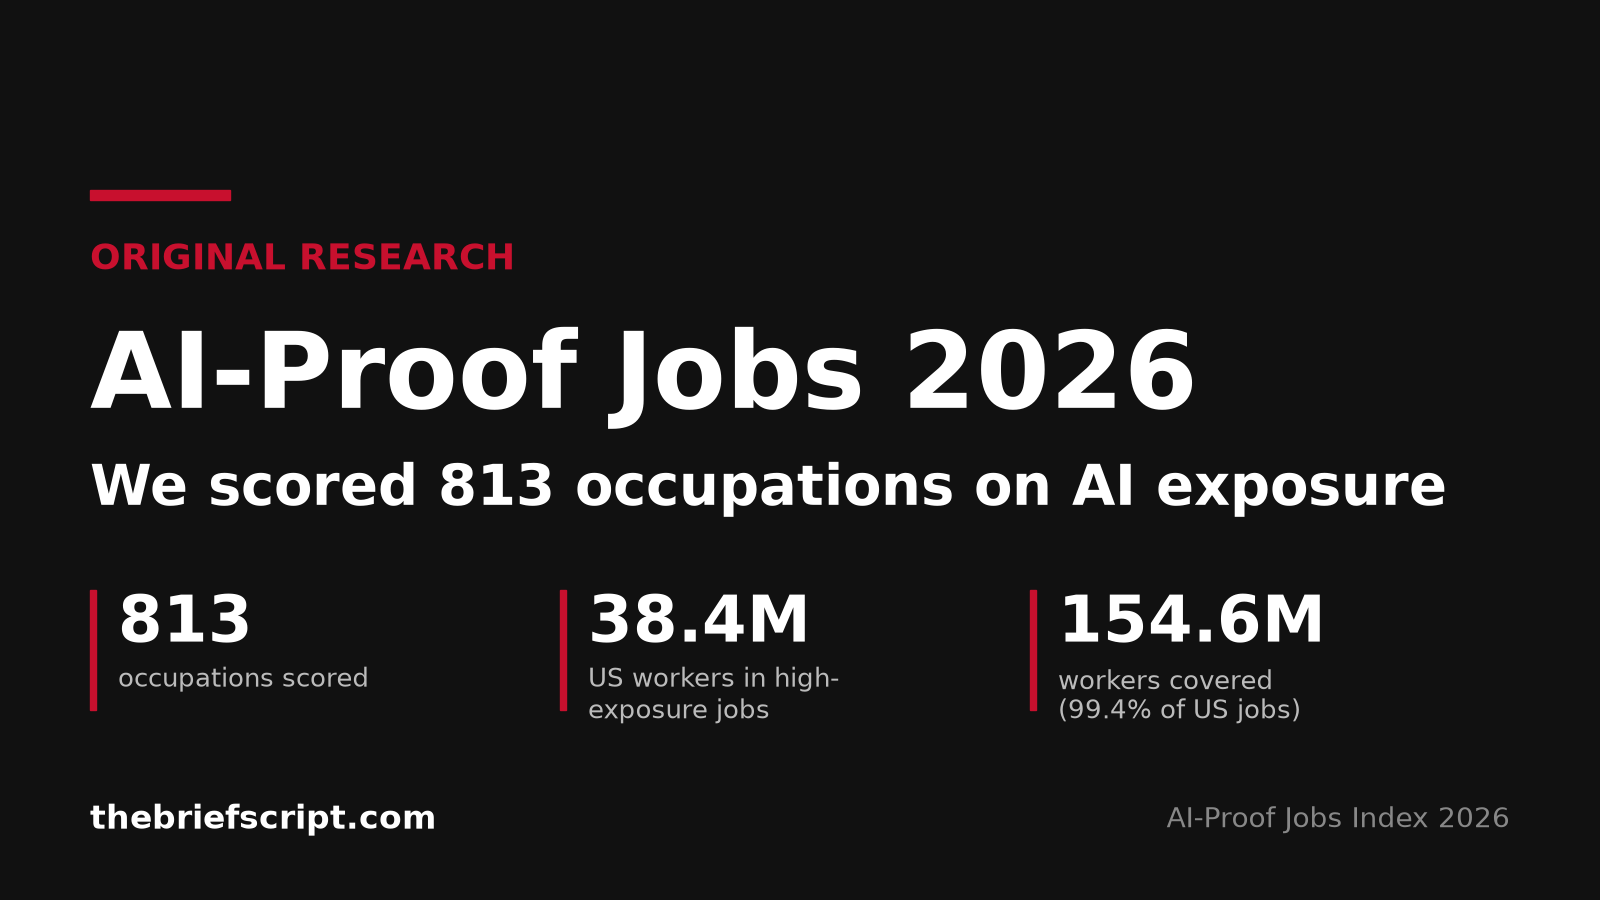
The Brief Script AI-Proof Jobs Index 2026. Original research by The Brief Script, October 2026.
Which jobs are AI-proof, and which jobs will AI replace? Most lists that answer this are someone’s opinion. We built ours from data: three independent academic and industry measures of what AI can do, Anthropic’s records of how people actually use AI at work, and the US government’s own employment, wage and growth figures. We combined them into three scores for 813 US occupations covering 154.6 million workers, 99.4% of US jobs.
The short answer: the most AI-proof jobs in 2026 are hands-on care and skilled trades. Physical therapist assistants, massage therapists, roofers, orderlies and home health aides top our AI-Proof Score. The most exposed jobs are language, writing, data and phone work: interpreters and translators, writers and authors, telemarketers, mathematicians and proofreaders top our AI Exposure Score, with customer service representatives (2.6 million workers) the biggest single group near the top.
One rule runs through every number below: exposure is not job loss. A high score means AI can do or speed up a large share of a job’s tasks. It does not mean the job disappears. Anthropic’s March 2026 analysis found no systematic rise in unemployment among highly exposed workers since late 2022.
Key findings
- 38.4 million US workers (24.8%) are in high-exposure jobs, meaning an AI Exposure Score of 60 or more. Move the cut-off and the count swings from 4.9 million (score 80+) to 62.1 million (score 50+).
- Only 5.0% of workers (7.8 million) are in jobs that are both highly exposed and already heavily used with AI. That is the group where change is most likely to show up first.
- Real AI use covers about 40% of what theory says it could. Weighted by workers, Anthropic’s observed task coverage is 0.128 against a theoretical exposure of 0.325.
- The top 25 AI-proof jobs employ 7.49 million people; 13 are construction, extraction or repair trades and 11 are healthcare or personal care.
- 13 of the 25 most exposed jobs are already projected by the BLS to shrink by 2035, led by telephone operators (−27.6%) and telemarketers (−21.4%).
- Degrees don’t protect you from exposure. Jobs that need a bachelor’s degree average 56.8 on our Exposure Score; jobs that need no formal credential average 26.9. The best-paid fifth of workers average 54.1, the lowest-paid fifth 32.3.
- The 100 most AI-proof jobs are projected to grow 9.0% by 2035 (+1.8 million jobs), against 0.9% for the 100 most exposed. Growth is part of the AI-Proof Score, so part of this gap is by design.
- AI layoffs are real but small next to the workforce: employers cited AI for 120,136 announced US job cuts in January to September 2026, 21% of all cuts and the #1 stated reason. Those announcements can’t be tied to specific occupations.
What we built: three scores for every job
The AI-Proof Jobs Index 2026 gives every occupation three scores from 0 to 100. Each is relative: 100 is the highest-scoring occupation in the dataset and 0 the lowest, not an absolute probability.
| Index | What it measures | What goes in it |
|---|---|---|
| AI Exposure Score | How much of a job’s work AI could, in theory, do or speed up | Equal-weight blend of three independent measures: the OpenAI/UPenn “GPTs are GPTs” task ratings (Eloundou et al.), Microsoft’s Copilot-based AI applicability score, and the Felten-Raj-Seamans language-model exposure index |
| AI Adoption Signal | How much people in the job already use AI for its tasks | Anthropic’s observed exposure (share of the job’s tasks already covered by work use of Claude, 50%), plus Claude.ai and Claude API usage per worker (25% each) |
| AI-Proof Score | How well-placed a job is overall | Low exposure (60%), BLS projected growth 2025–35 (20%), and human presence: physical work plus caring for and working close to people, from O*NET and Microsoft (20%) |
We kept usage out of the Exposure Score on purpose. Keeping theory and practice separate is what lets us test how far real adoption lags what AI could do. Exact formulas, versions and robustness tests are in the Methodology.
The 25 most AI-proof jobs in 2026
The top of the AI-Proof Score is dominated by work that happens with your hands, on your feet, or next to another person. Physical therapist assistants score 100: low exposure (20.2), strong projected growth (+23.0%) and one of the highest human-presence readings in the data. Roofers, cement masons and roustabouts have almost no AI exposure at all (scores of 1 to 3).
| # | Occupation | AI-Proof Score | Exposure | Workers | Median wage | BLS growth 2025–35 |
|---|---|---|---|---|---|---|
| 1 | Physical Therapist Assistants | 100.0 | 20.2 | 112,430 | $68,380 | +23.0% |
| 2 | Massage Therapists | 98.1 | 14.1 | 98,790 | $58,450 | +15.3% |
| 3 | Roofers | 97.9 | 2.3 | 135,490 | $55,440 | +5.3% |
| 4 | Orderlies | 97.3 | 5.5 | 52,440 | $38,290 | +4.0% |
| 5 | Home Health and Personal Care Aides† | 95.7 | 21.9 | 4,305,810 | $35,800 | +18.1% |
| 6 | Wind Turbine Service Technicians | 94.9 | 17.6 | 9,980 | $64,120 | +29.5% |
| 7 | Medical Equipment Preparers | 94.3 | 11.8 | 77,420 | $47,700 | +10.8% |
| 8 | Roustabouts, Oil and Gas | 93.8 | 1.9 | 44,970 | $46,960 | +3.6% |
| 9 | Surgical Technologists | 93.4 | 13.2 | 117,460 | $64,650 | +5.0% |
| 10 | Construction Laborers | 93.2 | 6.0 | 1,096,780 | $47,120 | +7.3% |
| 11 | Cement Masons and Concrete Finishers | 93.1 | 1.0 | 206,170 | $57,020 | +1.6% |
| 12 | Structural Iron and Steel Workers | 93.0 | 2.6 | 68,380 | $62,780 | +3.1% |
| 13 | Helpers–Extraction Workers | 93.0 | 4.2 | 6,700 | $47,730 | +1.7% |
| 14 | Prosthodontists | 92.8 | 15.8 | 870 | $311,180 | +5.8% |
| 15 | Electrical Power-Line Installers and Repairers | 92.8 | 13.7 | 131,070 | $95,320 | +10.3% |
| 16 | Highway Maintenance Workers | 92.7 | 5.1 | 154,960 | $50,260 | +3.4% |
| 17 | Floor Layers, Except Carpet, Wood, and Hard Tiles | 92.4 | 7.9 | 23,640 | $56,460 | +9.0% |
| 18 | Rail-Track Laying and Maintenance Equipment Operators | 92.2 | 1.2 | 19,580 | $70,070 | +1.5% |
| 19 | Ophthalmic Medical Technicians | 92.1 | 23.4 | 71,010 | $45,570 | +21.4% |
| 20 | Fence Erectors | 92.1 | 6.1 | 24,480 | $47,980 | +5.6% |
| 21 | Oral and Maxillofacial Surgeons | 91.9 | 15.4 | 4,910 | $352,220 | +5.6% |
| 22 | Dining Room and Cafeteria Attendants and Bartender Helpers | 91.8 | 6.8 | 542,750 | $33,980 | +5.3% |
| 23 | Surgical Assistants | 91.5 | 18.4 | 22,270 | $66,800 | +6.1% |
| 24 | Floor Sanders and Finishers | 91.4 | 2.0 | 3,720 | $50,440 | +1.4% |
| 25 | Physician Assistants | 91.1 | 25.7 | 162,150 | $135,880 | +21.1% |
† Home health and personal care aides use a BLS aggregate code; its exposure inputs are averaged from its two detailed occupations. Workers and wages: BLS OEWS May 2025. Growth: BLS Employment Projections 2025–35.
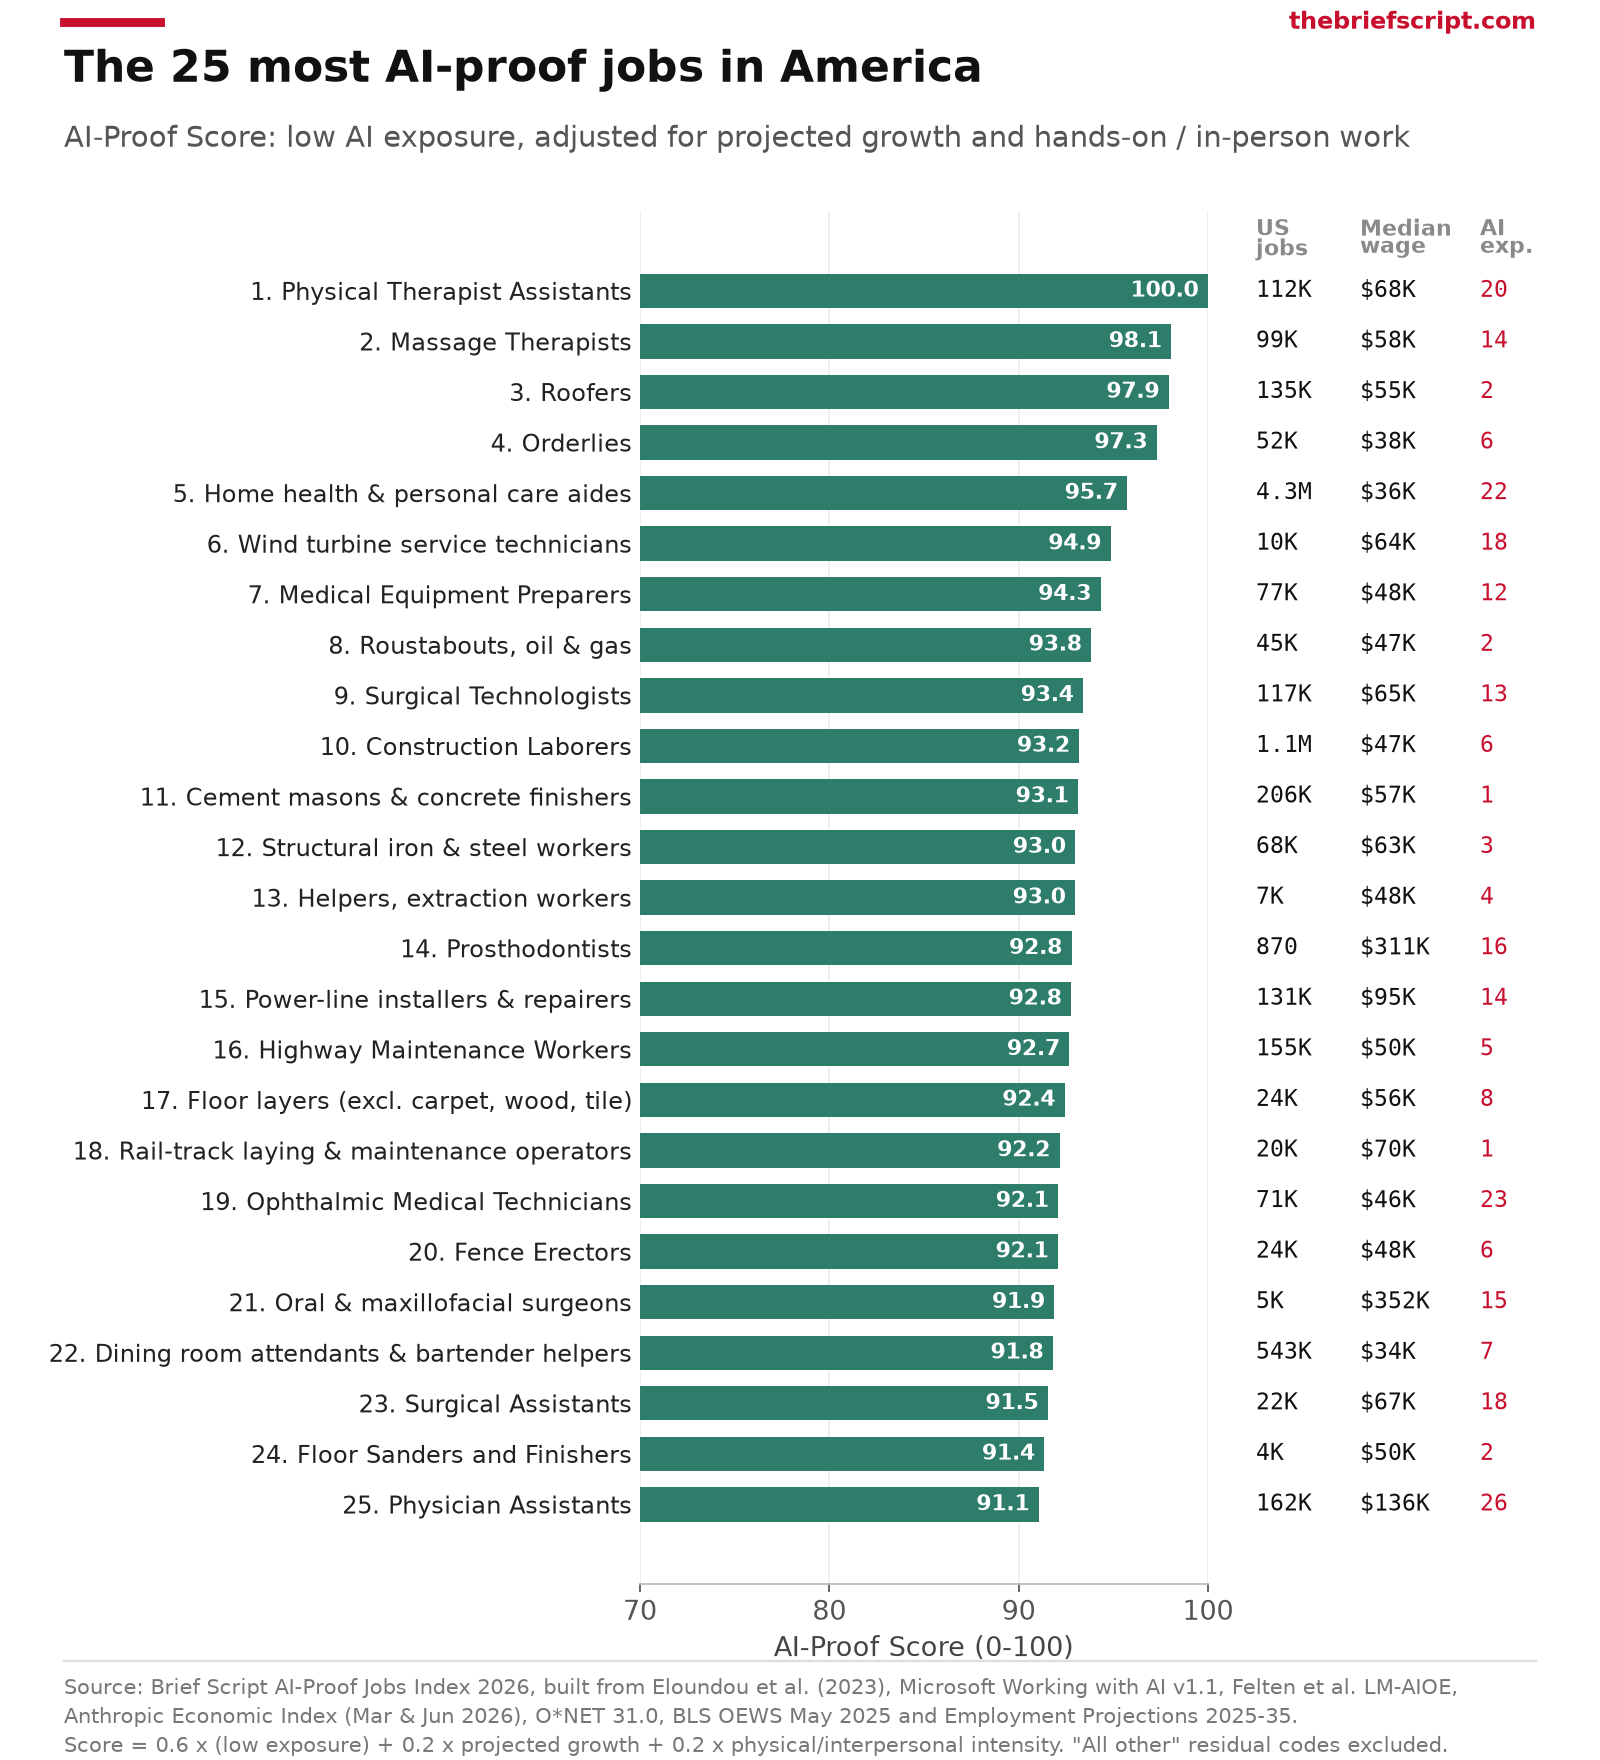
Three things stand out. First, the list isn’t all low-paid. It includes prosthodontists ($311,180), oral and maxillofacial surgeons ($352,220), physician assistants ($135,880) and electrical power-line installers ($95,320). Second, it’s big: home health and personal care aides alone are 4.3 million workers, and construction laborers another 1.1 million. Third, the median of these 25 jobs’ median wages is $56,460, a little above the $50,980 US median.
How solid is the ranking? 20 of the 25 stay in the top 50 in at least 80% of our 18 alternative specifications. The trades are the most stable: roofers never fall below #11. Physician assistants, ophthalmic medical technicians and wind turbine technicians lean most on the growth and human-presence parts. Rank on low exposure alone and they drop to between #189 and #289.
What this means: The safest ground in 2026 is work AI can’t physically reach: fixing, building, treating and caring. If you’re choosing a career, the healthcare roles on this list combine low exposure with fast projected growth.
The 25 jobs most exposed to AI
At the other end, the AI Exposure Score is topped by jobs built around language, text, numbers and phone calls. Interpreters and translators score 100 and rank #1 or #2 under all 11 exposure specifications we tested. Writers and authors (94.0), telemarketers (89.7), mathematicians (89.0) and proofreaders (87.5) follow.
These are the jobs people mean when they search for “jobs AI will replace.” The more accurate phrase is “jobs where AI can do the most tasks.” Whether that turns into fewer jobs depends on demand, regulation and how employers redesign the work.
| # | Occupation | AI Exposure Score | Adoption | Workers | Median wage | BLS growth 2025–35 |
|---|---|---|---|---|---|---|
| 1 | Interpreters and Translators | 100.0 | 72.4 | 52,060 | $60,170 | +2.0% |
| 2 | Writers and Authors | 94.0 | 61.0 | 47,940 | $76,910 | −0.3% |
| 3 | Telemarketers | 89.7 | 55.7 | 58,430 | $35,450 | −21.4% |
| 4 | Mathematicians | 89.0 | 83.8 | 2,030 | $126,710 | +0.6% |
| 5 | Proofreaders and Copy Markers | 87.5 | 55.7 | 4,580 | $51,120 | −0.9% |
| 6 | Sales Representatives of Services (except advertising, insurance, financial, travel) | 85.1 | 25.6 | 1,256,010 | $69,990 | +2.7% |
| 7 | Public Relations Specialists | 84.0 | 59.6 | 283,380 | $74,750 | +1.8% |
| 8 | Historians | 83.8 | 35.4 | 3,450 | $76,750 | +3.0% |
| 9 | Telephone Operators | 82.5 | 15.0 | 3,430 | $41,740 | −27.6% |
| 10 | Brokerage Clerks | 82.4 | 23.8 | 35,940 | $65,750 | −7.6% |
| 11 | News Analysts, Reporters, and Journalists | 82.2 | 55.0 | 39,250 | $62,200 | −5.9% |
| 12 | Technical Writers | 82.1 | 79.4 | 45,500 | $90,390 | +0.8% |
| 13 | Customer Service Representatives | 81.8 | 70.0 | 2,595,750 | $44,770 | −5.3% |
| 14 | Correspondence Clerks | 80.8 | 63.4 | 4,290 | $46,800 | −5.6% |
| 15 | Web Developers | 80.7 | 74.0 | 70,190 | $92,650 | +3.8% |
| 16 | Broadcast Announcers and Radio Disc Jockeys | 80.6 | 31.6 | 21,240 | $47,340 | −7.6% |
| 17 | Political Scientists | 80.4 | 74.6 | 5,540 | $142,080 | −2.0% |
| 18 | Computer Programmers | 80.3 | 100.0 | 92,230 | $100,390 | −7.3% |
| 19 | Statistical Assistants | 79.9 | 86.8 | 4,710 | $50,330 | −1.8% |
| 20 | Editors | 79.8 | 56.8 | 91,690 | $77,920 | −1.1% |
| 21 | Software Quality Assurance Analysts and Testers | 79.0 | 77.2 | 186,740 | $104,300 | +5.7% |
| 22 | Database Architects | 78.9 | 86.8 | 67,140 | $139,500 | +9.4% |
| 23 | Statisticians | 78.9 | 53.3 | 29,030 | $105,650 | +11.0% |
| 24 | Philosophy and Religion Teachers, Postsecondary | 78.6 | 50.1 | 20,460 | $80,260 | +2.0% |
| 25 | English Language and Literature Teachers, Postsecondary | 78.3 | 54.5 | 57,720 | $78,760 | 0.0% |
Adoption = AI Adoption Signal (0–100). Workers and wages: BLS OEWS May 2025. Growth: BLS Employment Projections 2025–35.
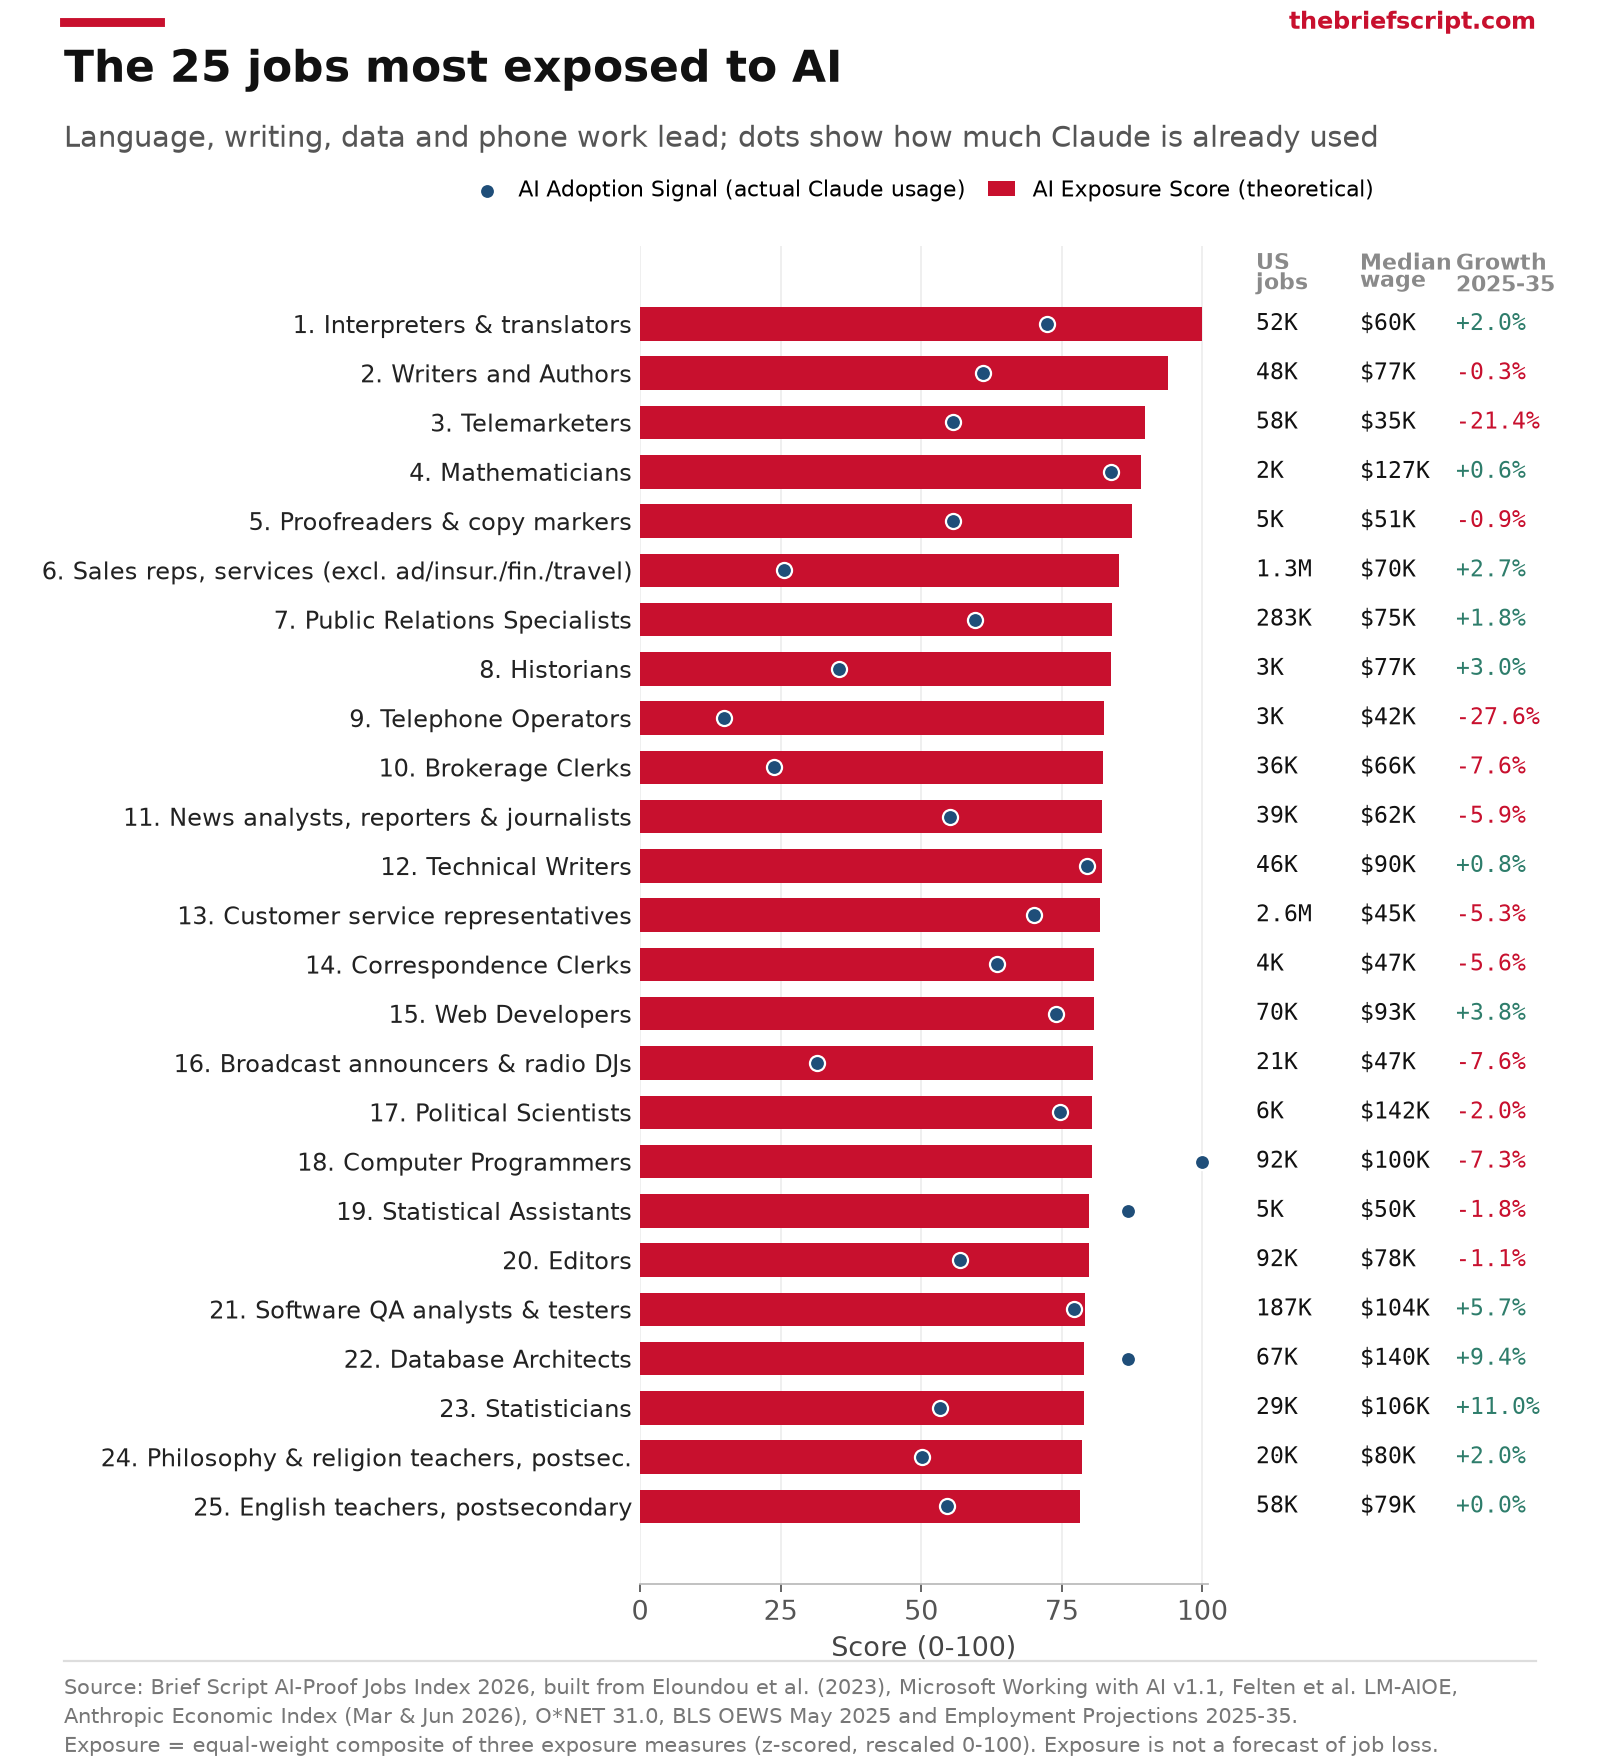
The top 25 employ 5.08 million people, and two occupations carry most of that: customer service representatives (2.6 million, score 81.8) and services sales representatives (1.26 million, 85.1). These jobs also pay more than the AI-proof list. The median of their median wages is $76,750, about $20,000 higher.
The BLS already expects many of them to shrink. 13 of the 25 are projected to decline by 2035, including telephone operators (−27.6%), telemarketers (−21.4%), brokerage clerks and broadcast announcers (each −7.6%), computer programmers (−7.3%) and customer service representatives (−5.3%).
Where do familiar jobs land? Out of 813: software developers score 71.4 (#74), accountants and auditors 61.3 (#163), lawyers 58.5 (#195), retail salespersons 55.3 (#235), elementary school teachers 50.1 (#300), registered nurses 40.2 (#383), electricians 24.4 (#540) and plumbers 13.3 (#690). For two sectors in more depth, see our reality checks on finance jobs and cybersecurity.
What this means: High exposure is a signal to change how you work, not a verdict. Writers, analysts and developers who use AI to do more are a different case from telephone operators, where demand was already falling.
AI-proof and well paid
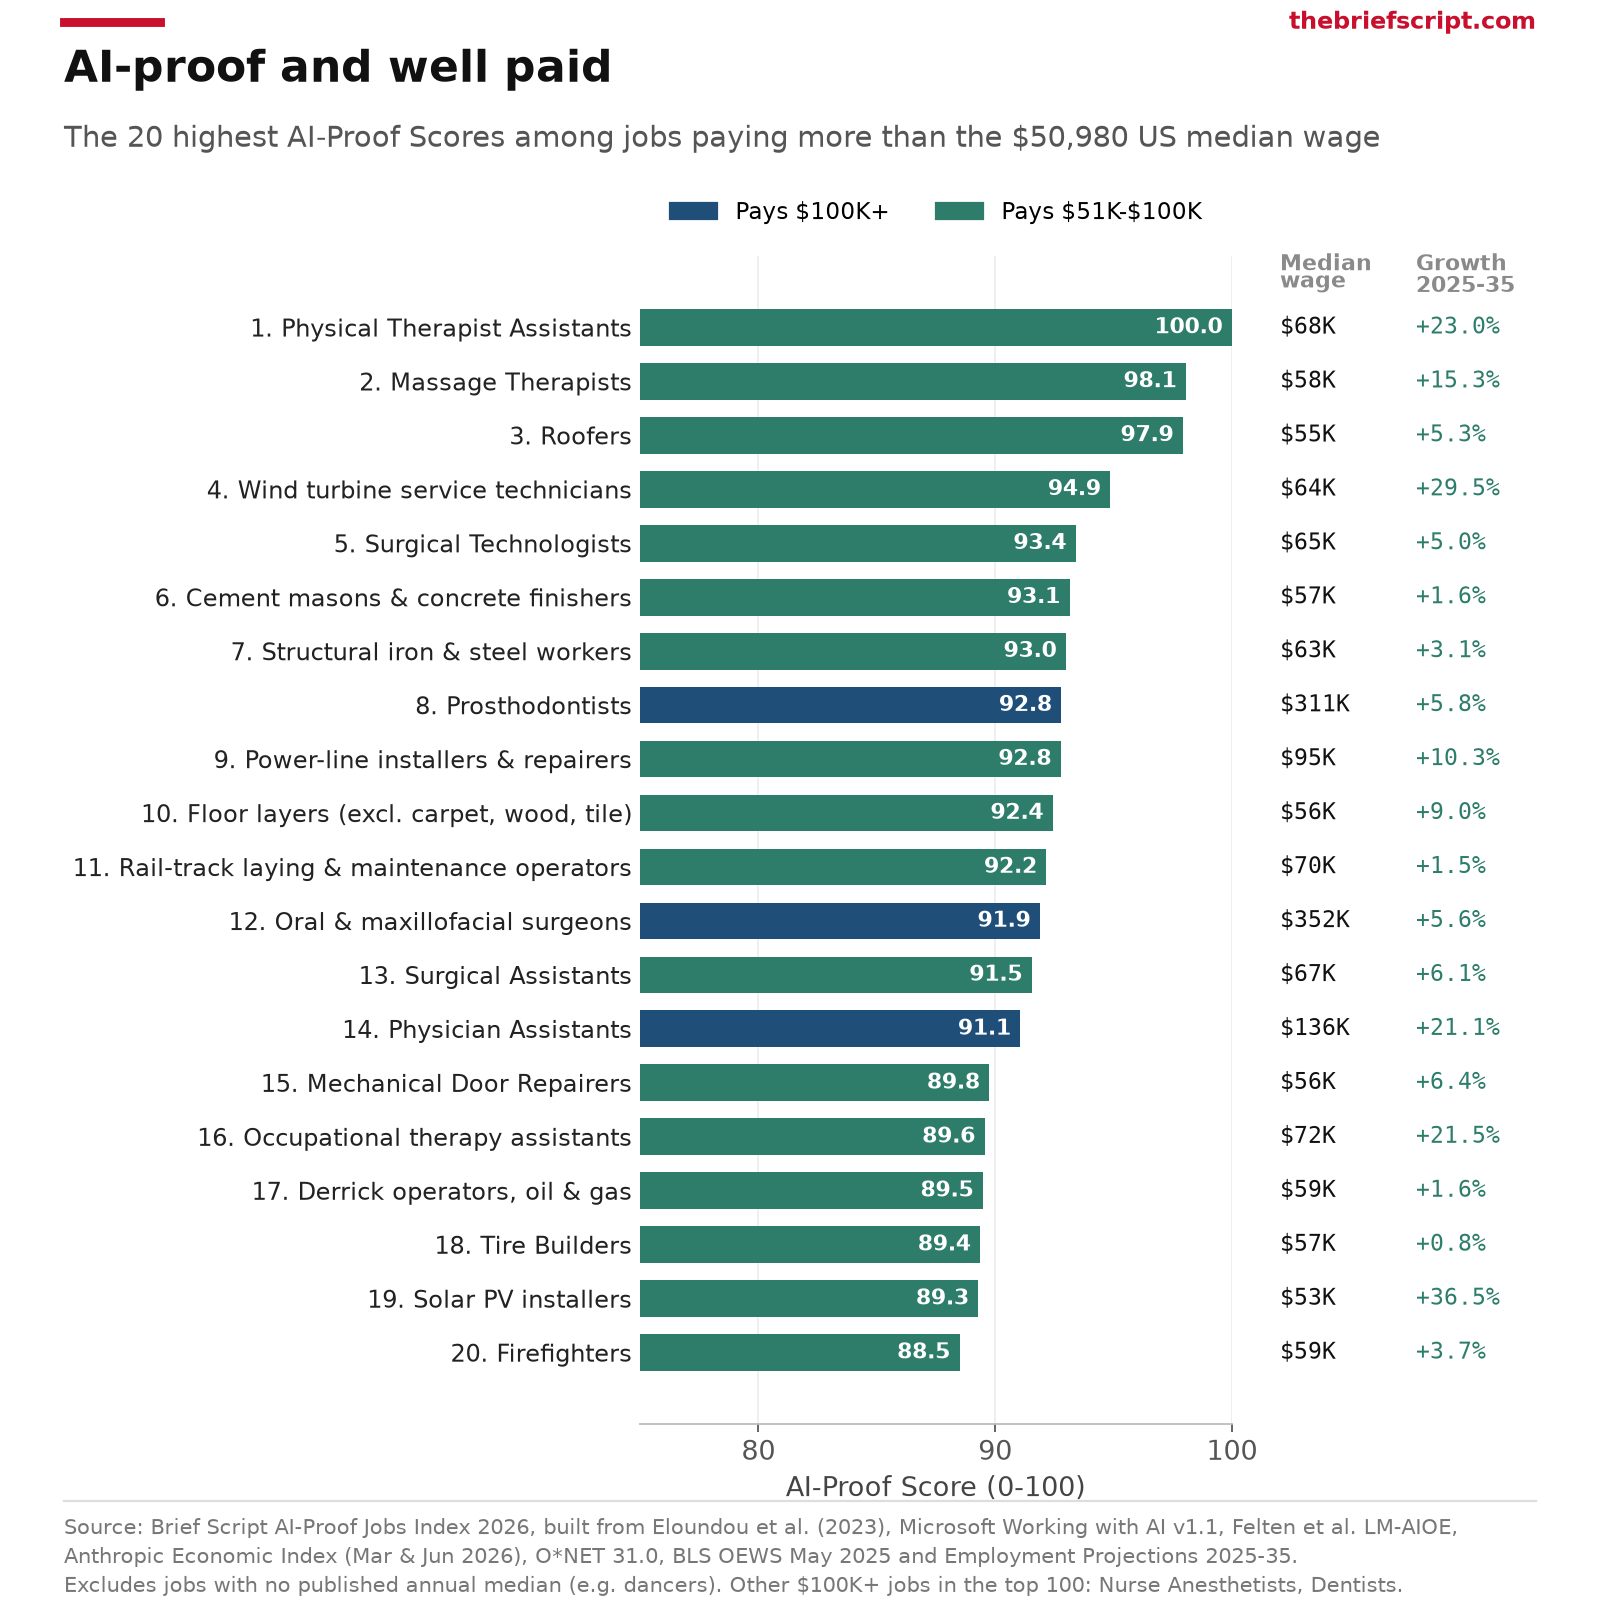
Low exposure is easy to find in low-wage work. The harder question is which jobs are both AI-proof and pay well. These are the highest AI-Proof Scores among jobs paying more than the $50,980 US median.
| # | Occupation | Median wage | Workers | BLS growth | AI-Proof | Exposure |
|---|---|---|---|---|---|---|
| 1 | Physical Therapist Assistants | $68,380 | 112,430 | +23.0% | 100.0 | 20.2 |
| 2 | Massage Therapists | $58,450 | 98,790 | +15.3% | 98.1 | 14.1 |
| 3 | Roofers | $55,440 | 135,490 | +5.3% | 97.9 | 2.3 |
| 4 | Wind Turbine Service Technicians | $64,120 | 9,980 | +29.5% | 94.9 | 17.6 |
| 5 | Surgical Technologists | $64,650 | 117,460 | +5.0% | 93.4 | 13.2 |
| 6 | Cement Masons and Concrete Finishers | $57,020 | 206,170 | +1.6% | 93.1 | 1.0 |
| 7 | Structural Iron and Steel Workers | $62,780 | 68,380 | +3.1% | 93.0 | 2.6 |
| 8 | Prosthodontists | $311,180 | 870 | +5.8% | 92.8 | 15.8 |
| 9 | Electrical Power-Line Installers and Repairers | $95,320 | 131,070 | +10.3% | 92.8 | 13.7 |
| 10 | Floor Layers, Except Carpet, Wood, and Hard Tiles | $56,460 | 23,640 | +9.0% | 92.4 | 7.9 |
| 11 | Rail-Track Laying and Maintenance Equipment Operators | $70,070 | 19,580 | +1.5% | 92.2 | 1.2 |
| 12 | Oral and Maxillofacial Surgeons | $352,220 | 4,910 | +5.6% | 91.9 | 15.4 |
| 13 | Surgical Assistants | $66,800 | 22,270 | +6.1% | 91.5 | 18.4 |
| 14 | Physician Assistants | $135,880 | 162,150 | +21.1% | 91.1 | 25.7 |
| 15 | Mechanical Door Repairers | $55,720 | 27,120 | +6.4% | 89.8 | 13.7 |
Many of the trades here sit only just above the median, in the mid-$50,000s. Pay climbs in healthcare and utilities: power-line installers ($95,320), dental hygienists ($98,100), physician assistants ($135,880, +21.1% growth) and the two dental surgery specialties.
Among jobs paying $100,000 or more, the highest AI-Proof Scores also include nurse anesthetists ($236,590, overall rank #77), general dentists ($170,950, #99), elevator and escalator installers ($109,910), optometrists ($136,570), radiation therapists, ship engineers, physical therapists ($102,760, +11.9%), occupational therapists, anesthesiologists ($391,490) and nurse practitioners ($132,300, +41.0%, the fastest-growing on the list).
What this means: If you want low AI exposure and six figures, the clearest paths are licensed clinical roles (PA, nurse practitioner, nurse anesthetist, therapy) and a handful of specialized trades like elevator and power-line work.
AI exposure by occupation group
Grouping jobs into the 22 major SOC families makes the pattern blunt. Office, computer and business work sits at the top; work done with hands and bodies sits at the bottom.
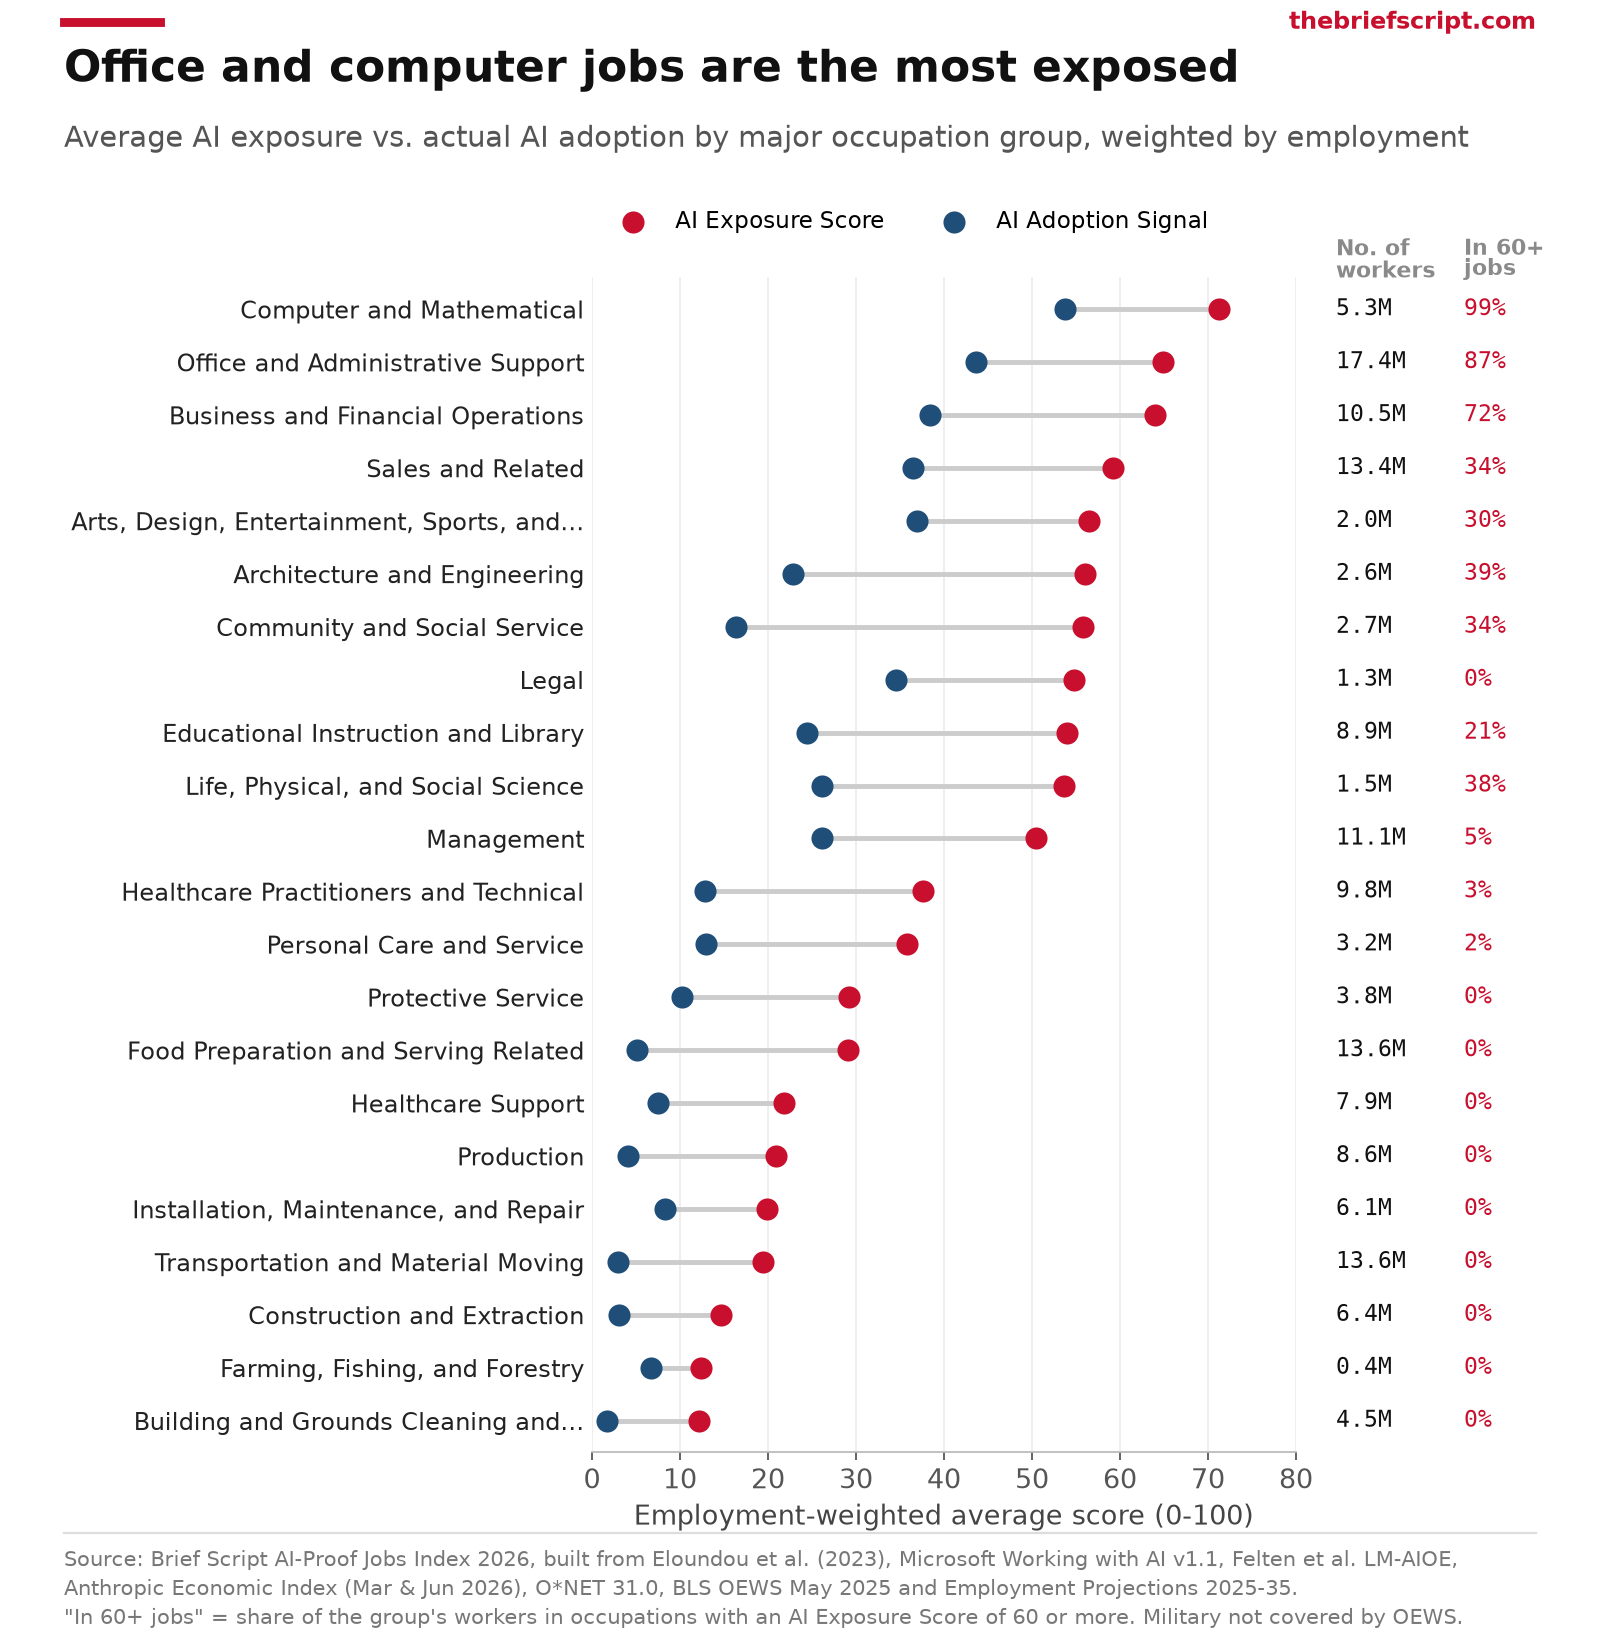
| Occupation group | Workers | Exposure (avg) | Adoption (avg) | Workers in 60+ jobs | BLS growth 2025–35 |
|---|---|---|---|---|---|
| Computer and Mathematical | 5.3M | 71.3 | 53.8 | 98.8% | +7.4% |
| Office and Administrative Support | 17.4M | 64.9 | 43.6 | 87.1% | −4.1% |
| Business and Financial Operations | 10.5M | 64.0 | 38.4 | 72.0% | +5.5% |
| Sales and Related | 13.4M | 59.2 | 36.5 | 33.9% | −1.5% |
| Arts, Design, Entertainment, Sports, and Media | 2.0M | 56.5 | 36.9 | 30.2% | +1.6% |
| Architecture and Engineering | 2.6M | 56.1 | 22.8 | 39.2% | +6.8% |
| Community and Social Service | 2.7M | 55.8 | 16.4 | 34.5% | +8.2% |
| Legal | 1.3M | 54.8 | 34.5 | 0.0% | +2.8% |
| Educational Instruction and Library | 8.9M | 54.0 | 24.4 | 21.4% | +1.3% |
| Life, Physical, and Social Science | 1.5M | 53.7 | 26.1 | 38.5% | +7.8% |
| Management | 11.1M | 50.4 | 26.1 | 4.7% | +6.9% |
| Healthcare Practitioners and Technical | 9.8M | 37.7 | 12.8 | 3.2% | +8.0% |
| Personal Care and Service | 3.2M | 35.8 | 12.9 | 1.5% | +4.7% |
| Protective Service | 3.8M | 29.2 | 10.3 | 0.0% | +1.2% |
| Food Preparation and Serving Related | 13.6M | 29.0 | 5.1 | 0.0% | +4.3% |
| Healthcare Support | 7.9M | 21.8 | 7.5 | 0.0% | +13.2% |
| Production | 8.6M | 20.9 | 4.0 | 0.3% | −0.4% |
| Installation, Maintenance, and Repair | 6.1M | 19.9 | 8.3 | 0.0% | +5.5% |
| Transportation and Material Moving | 13.6M | 19.4 | 2.9 | 0.0% | +4.2% |
| Construction and Extraction | 6.4M | 14.6 | 3.0 | 0.0% | +5.1% |
| Farming, Fishing, and Forestry | 0.4M | 12.4 | 6.7 | 0.0% | −1.3% |
| Building and Grounds Cleaning and Maintenance | 4.5M | 12.1 | 1.7 | 0.0% | +2.6% |
Two details are worth knowing. Legal averages 54.8, yet none of its 1.3 million workers is in a job scoring 60 or more; lawyers score 58.5, just under the line. And actual usage is far more concentrated than exposure: computer and math jobs are 3.4% of US employment but 23.9% of Claude.ai conversations and 27.7% of Claude API traffic in April to May 2026.
What this means: Office and administrative support is the group to watch. It’s large (17.4 million workers), highly exposed (64.9), and the BLS already projects it to shrink 4.1% by 2035.
Pay and education: better-paid, more-educated jobs are more exposed
For decades, automation hit routine manual and clerical work hardest. Generative AI flips that. Across occupations, the correlation between median wage and AI exposure is +0.44. In a worker-weighted fit, each doubling of the wage adds about 13 points of exposure.
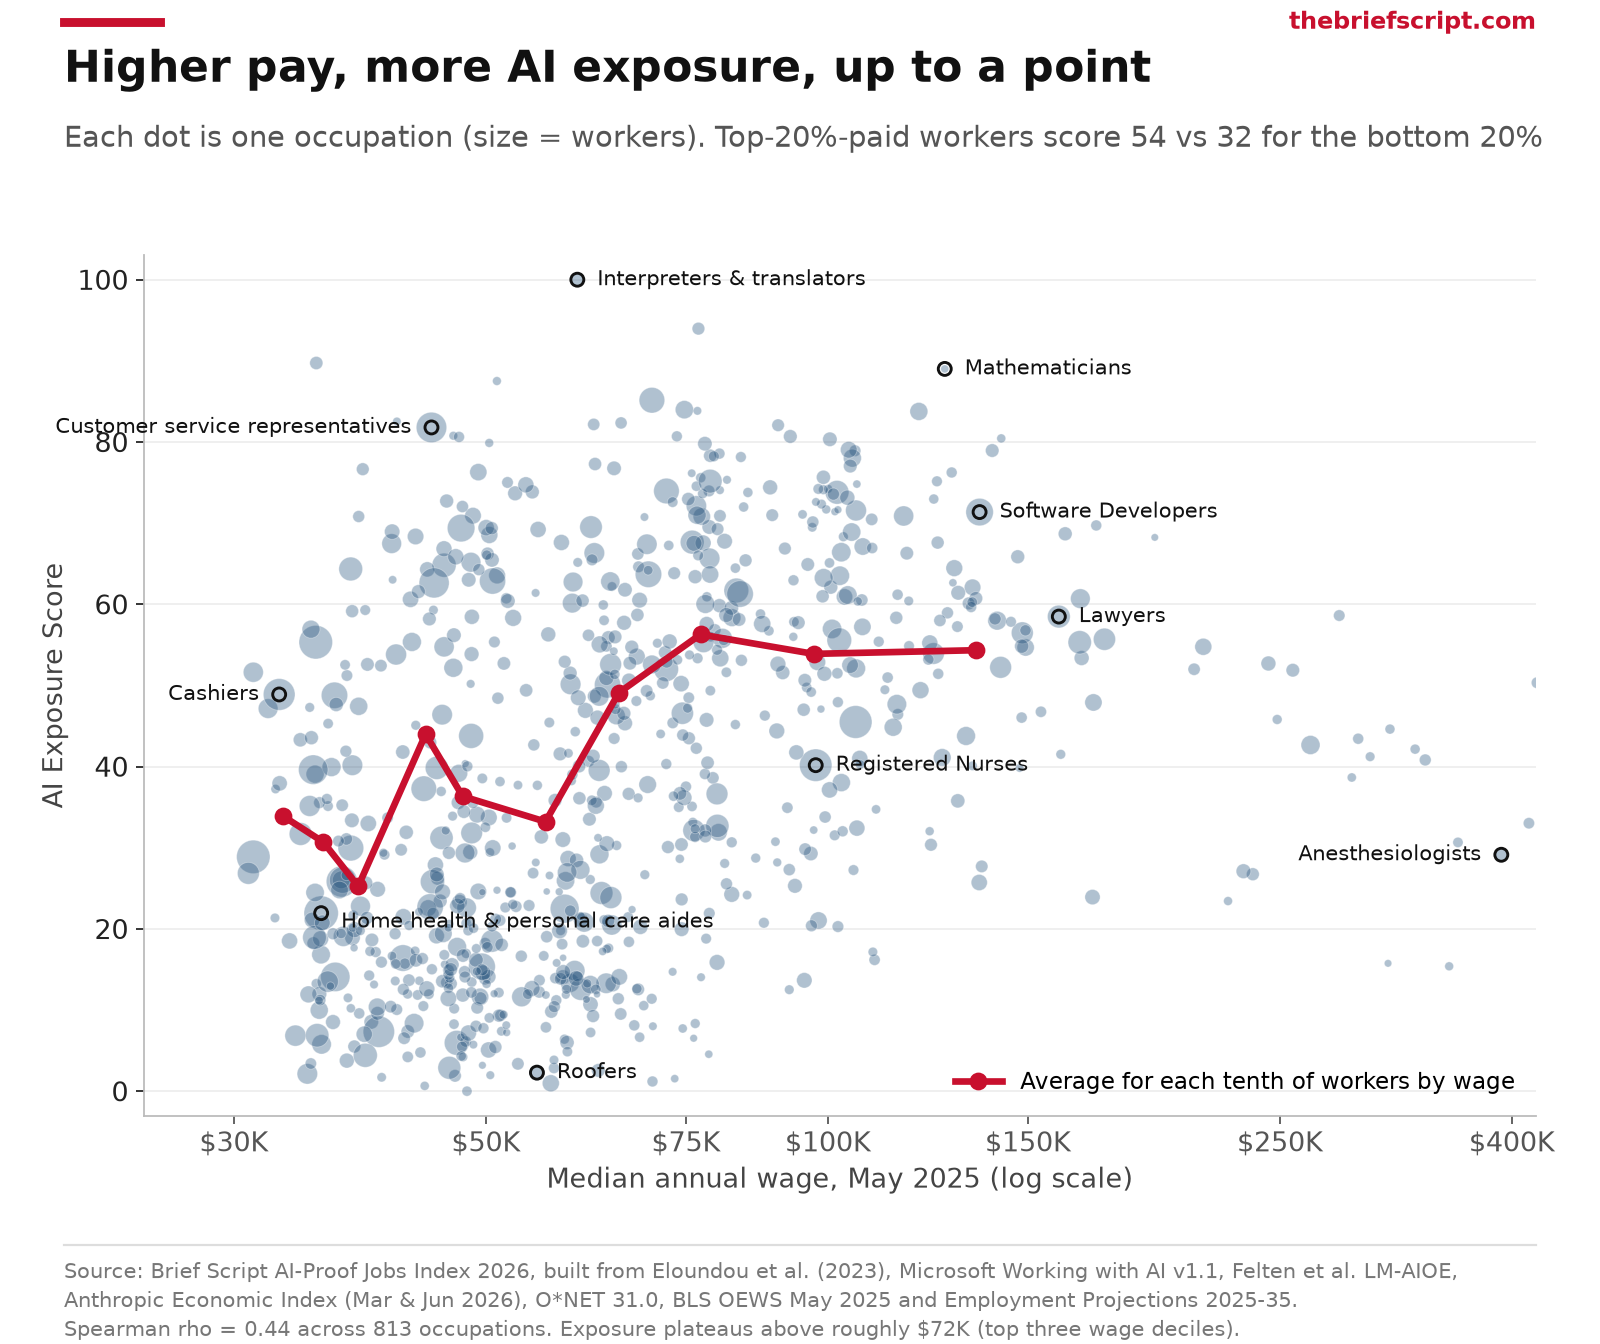
The relationship isn’t a straight line. Exposure rises sharply from the 6th wage decile (33.2) to the 8th, jobs paying roughly $72,000 to $84,000 (56.3). Then it flattens: 53.9 in the 9th decile and 54.3 in the top 10%. The best-paid jobs, such as physicians, surgeons and many engineers, mix cognitive work with physical, licensed or in-person work that AI can’t do. Of the 100 most exposed jobs, 81% pay above the US median; of the 100 most AI-proof, 52% do.
Education tells the same story. By the entry-level education the BLS lists for each job:
- Bachelor’s degree: 56.8 (38.7 million workers)
- Doctoral or professional degree: 55.5
- Master’s degree: 52.8
- High school diploma: 41.5
- Associate’s degree: 40.2
- No formal credential: 26.9
- Postsecondary certificate: 23.5, the lowest, because this group is mostly trades and healthcare technicians
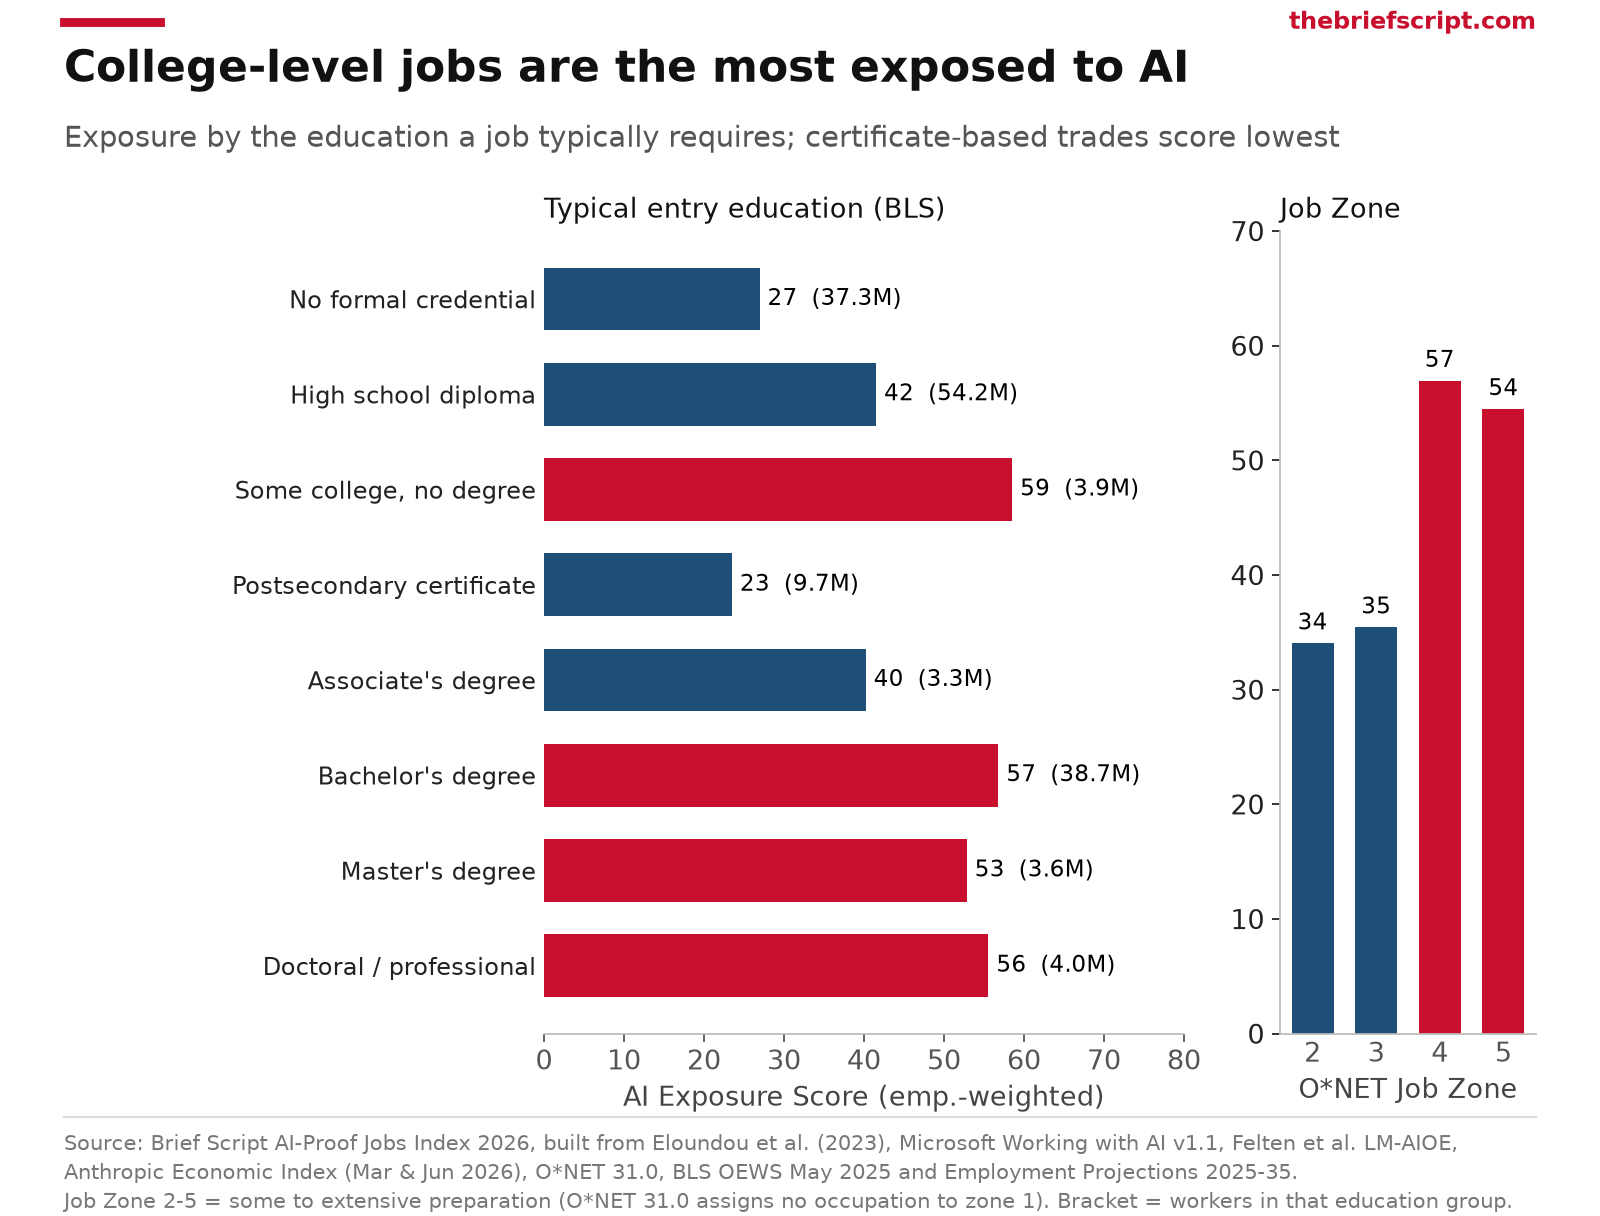
O*NET’s Job Zones, a measure of how much preparation a job needs, agree: zone 4 jobs average 56.9 and zone 2 jobs 34.1 (correlation +0.63). This matches what Anthropic found using Current Population Survey data: workers in the most exposed jobs tend to be more educated and better paid.
What this means: A degree is no longer a shield against technology. A trade certificate is, at least for now. That doesn’t make college a bad bet, since exposed jobs still pay more, but it changes what “safe” looks like.
How many US workers are in high-exposure jobs?
Our headline number is 38.4 million workers, 24.8% of covered employment, in 182 occupations scoring 60 or more. A score of 60 roughly matches the top quarter of occupations (58.0 and up). But any threshold is a choice, so here’s how the number moves:
| Definition | Occupations | Workers | Share of workers |
|---|---|---|---|
| Exposure Score 50+ | 300 | 62.1M | 40.2% |
| Exposure Score 60+ (headline) | 182 | 38.4M | 24.8% |
| Exposure Score 70+ | 85 | 14.3M | 9.2% |
| Exposure Score 80+ | 20 | 4.9M | 3.2% |
| Top quarter of occupations (58.0+) | 204 | 40.5M | 26.2% |
| Half of tasks LLM-exposed (OpenAI/UPenn) | 170 | 37.2M | 24.1% |
| 25%+ of tasks already covered by Claude use (Anthropic) | 87 | 33.4M | 21.6% |
| 10%+ of tasks already covered by Claude use | 190 | 55.4M | 35.9% |
| No tasks covered by Claude use yet | 425 | 57.6M | 37.3% |
| Exposure 60+ and Adoption 60+ | 30 | 7.8M | 5.0% |
| Low exposure (score under 20) | 219 | 28.3M | 18.3% |
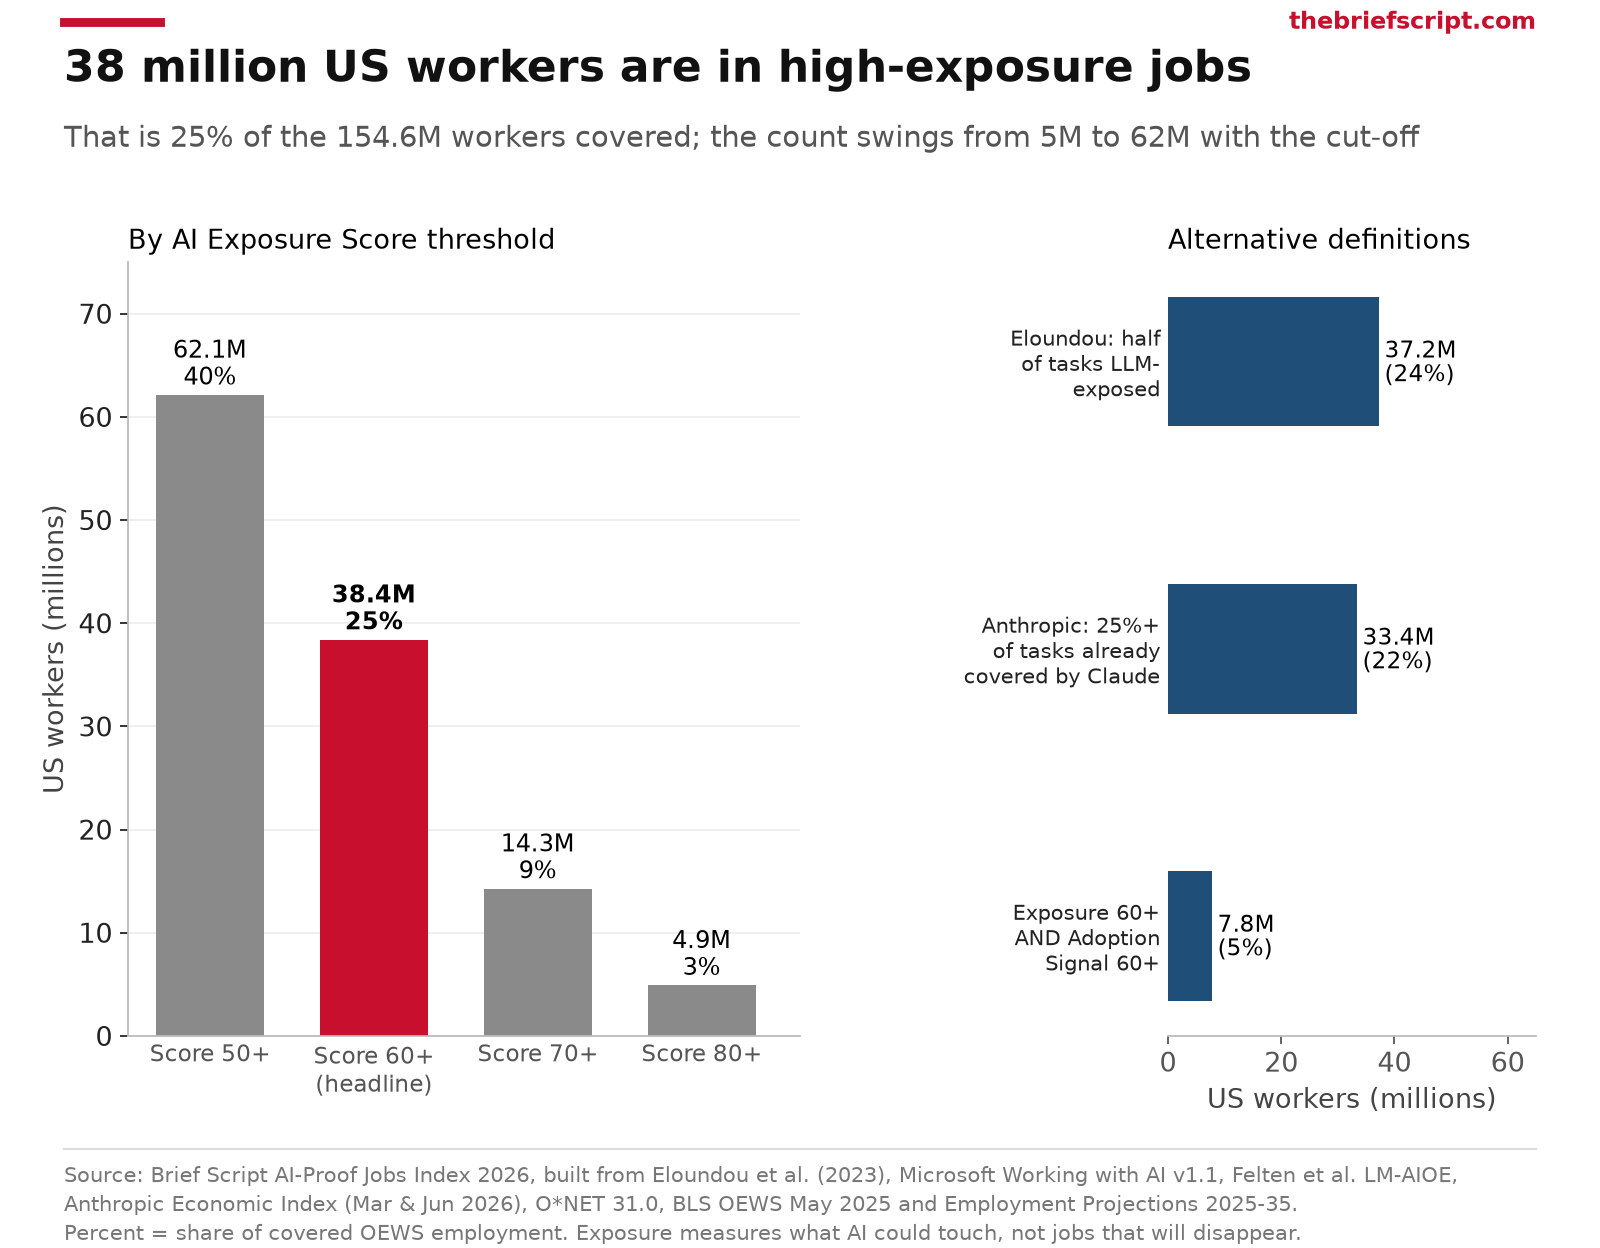
The honest summary: somewhere between one in ten and two in five US workers are in highly exposed jobs, depending on where you draw the line. Several independent definitions cluster around one in four: the top quartile (26.2%), half of tasks exposed in the OpenAI/UPenn data (24.1%), and a quarter of tasks already covered by Claude use (21.6%).
The more useful number may be the smallest. Only 7.8 million workers (5.0%) are in jobs that are both highly exposed and already heavily used with AI, 30 occupations in all. And 37.3% of workers are in jobs where Anthropic observes no AI task coverage at all. (Anthropic reports about 30% on the same measure using Current Population Survey employment weights; we use BLS OEWS weights.) The worker-weighted average Exposure Score across the whole economy is 41.7.
What this means: Treat any single “X million jobs at risk” headline with caution, including ours. The threshold drives the number. The steadier signal is that about a quarter of the workforce does work AI can heavily touch.
Theory vs. reality: how much AI is actually used
Exposure scores describe what AI could do. Usage data shows what people are doing. The two agree on the ranking: the correlation between our Exposure Score and Adoption Signal is 0.75. They disagree on scale. Weighted by workers, real Claude use covers 39.6% of the theoretical exposure.
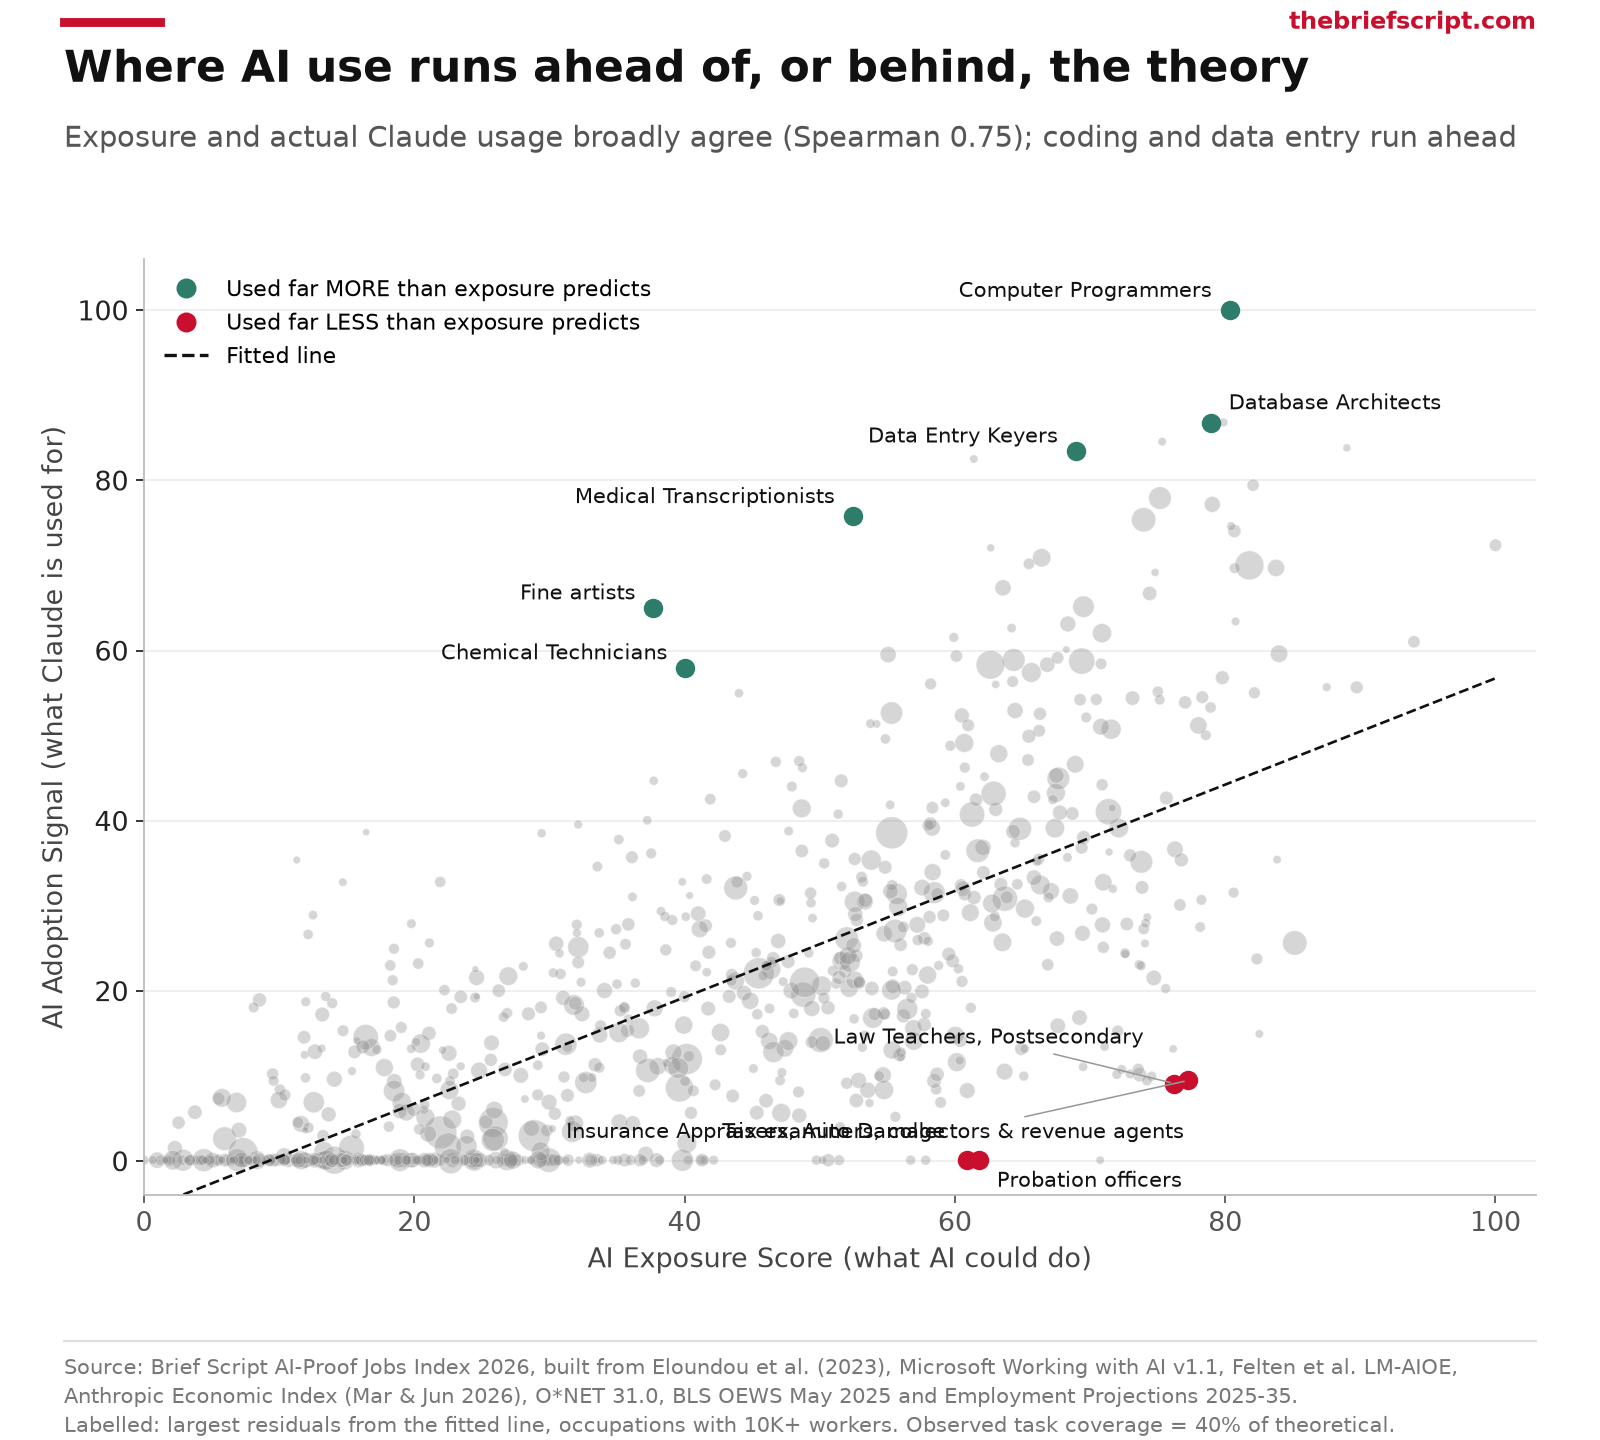
Some jobs use AI far more than their exposure predicts: computer programmers (adoption 100, exposure 80.3), medical transcriptionists, fine artists, data entry keyers, database architects, chemical technicians, market research analysts (900,000 workers), financial analysts, and wholesale and manufacturing sales representatives (1.24 million).
Others use it far less: tax examiners and revenue agents (exposure 77.3, adoption 9.5), law teachers, probation officers, auto-damage insurance appraisers, emergency management directors and 911 dispatchers. Most of these are public-sector, regulated or confidential jobs, where rules and data sensitivity slow adoption. Our AI regulation tracker follows the rules shaping that.
How people use AI matters too. In occupation-mapped Claude.ai conversations, 49.0% are automation (AI does the task) and the rest augmentation (AI helps a person do it). In API traffic, where businesses build AI into their own products, automation is 93.8%. And this is Claude data only. Usage of ChatGPT, Gemini and Copilot may skew differently; our Gemini vs ChatGPT vs Claude scorecard covers how the three compare.
What this means: The gap between theory and practice is where the next few years happen. Jobs with high exposure but low adoption, like tax examiners and dispatchers, haven’t felt AI yet. That’s a delay, not immunity.
Projected growth: the BLS already expects exposed jobs to grow less
We compared our scores with BLS Employment Projections for 2025–35. One caveat comes first: growth is 20% of the AI-Proof Score, so AI-proof jobs growing faster is partly built in. The cleaner test uses the Exposure Score, which contains no growth data.
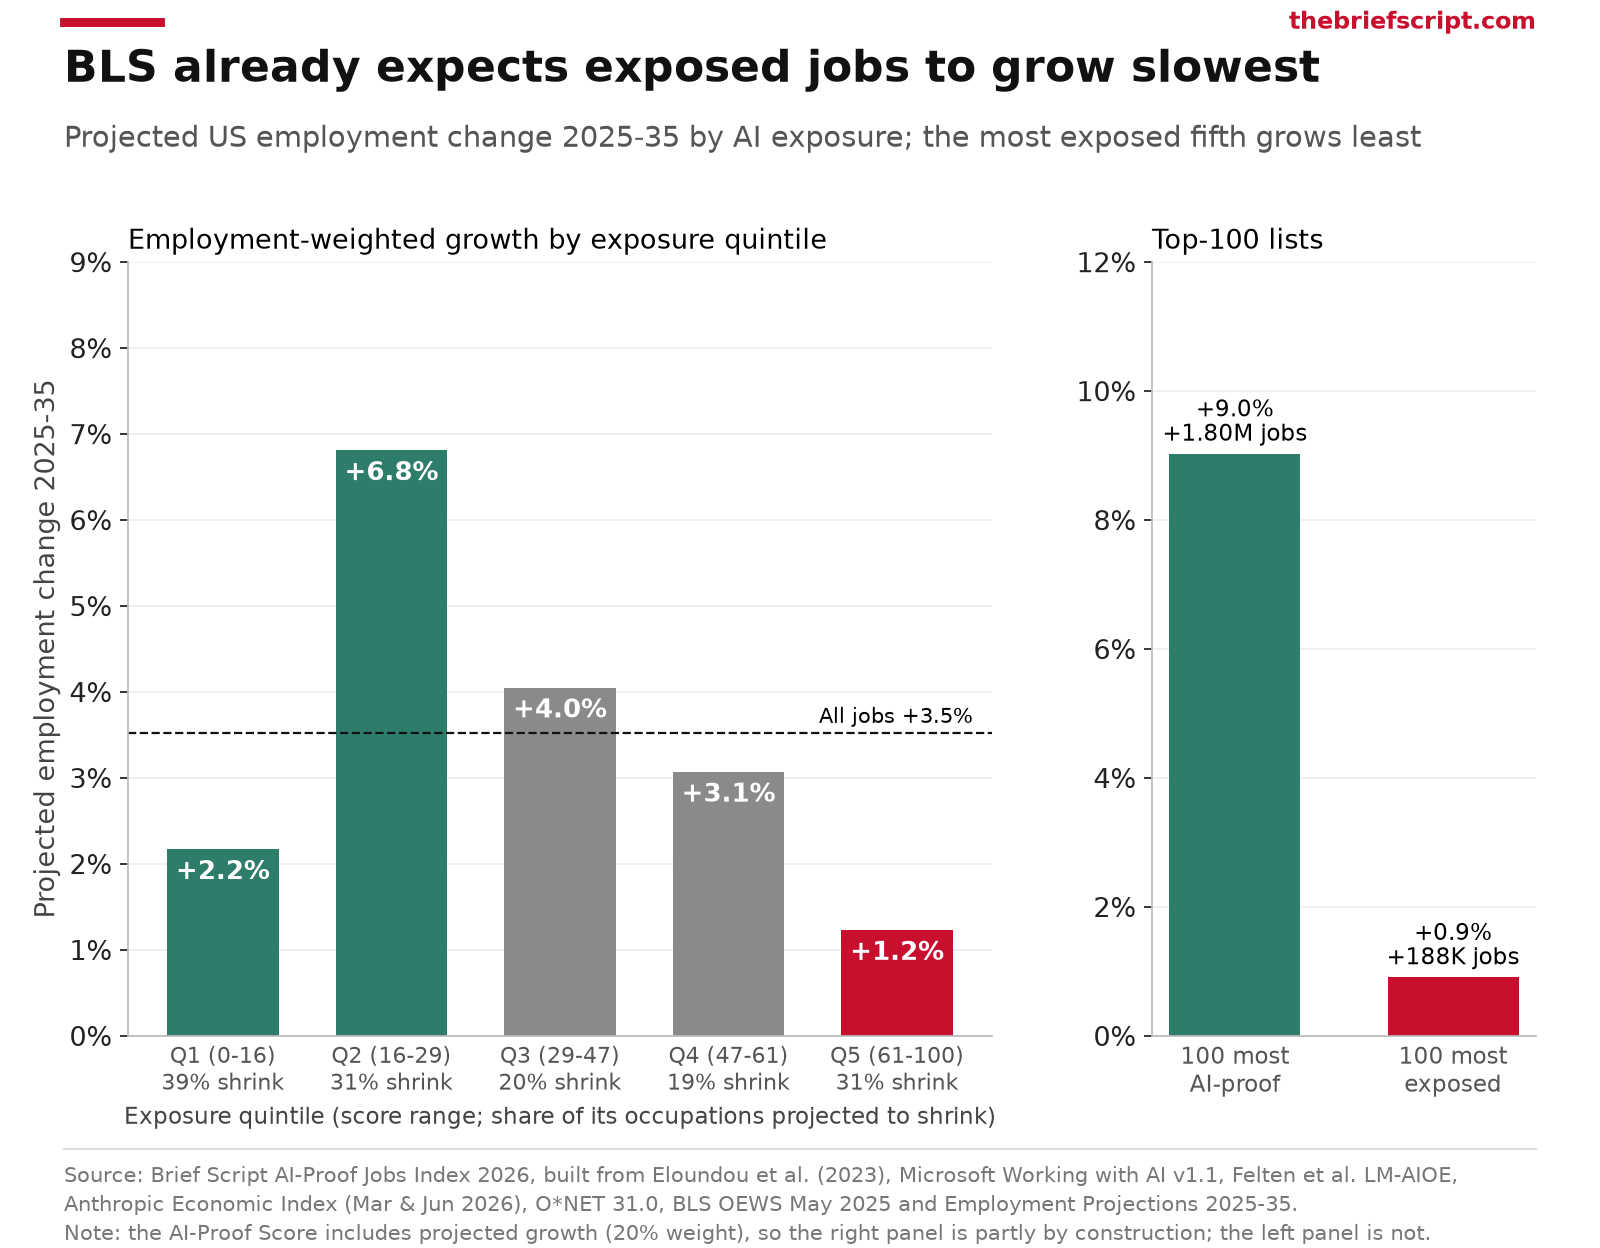
By exposure quintile, worker-weighted BLS growth is: least exposed +2.2%, second +6.8%, middle +4.0%, fourth +3.1%, most exposed +1.2%. All covered jobs: +3.5%. The 100 most AI-proof jobs are projected to add 1.8 million jobs (+9.0%); the 100 most exposed, 188,000 (+0.9%).
Across the economy, BLS growth falls about 0.46 percentage points for every 10 points of exposure, close to the −0.6 points per 10 points of observed coverage that Anthropic found on the earlier 2024–34 projections.
But the pattern is weaker than the headline suggests. It isn’t a straight line, and occupation by occupation the correlation between exposure and growth is actually slightly positive (+0.12). The least exposed quintile grows slowly too, because it includes production and transportation jobs that the BLS expects robots and other automation to shrink. It has the highest share of shrinking occupations (38.7%).
The clearest warning sign is overlap. 52 occupations with 15.3 million workers are both highly exposed (60+) and projected to shrink. The steepest declines: word processors and typists (−34.4%), telephone operators (−27.6%), switchboard operators (−26.0%), data entry keyers (−25.5%), telemarketers (−21.4%), order clerks (−17.5%), payroll clerks (−15.9%) and file clerks (−15.8%).
Remember that BLS projections already include the BLS’s own judgment about AI. This is a consistency check, not independent proof.
AI layoffs in 2026: what the Challenger numbers say
Exposure is about tasks. Layoffs are about decisions. The best public count of AI-linked layoffs comes from outplacement firm Challenger, Gray & Christmas, which records the reasons employers give for announced job cuts.
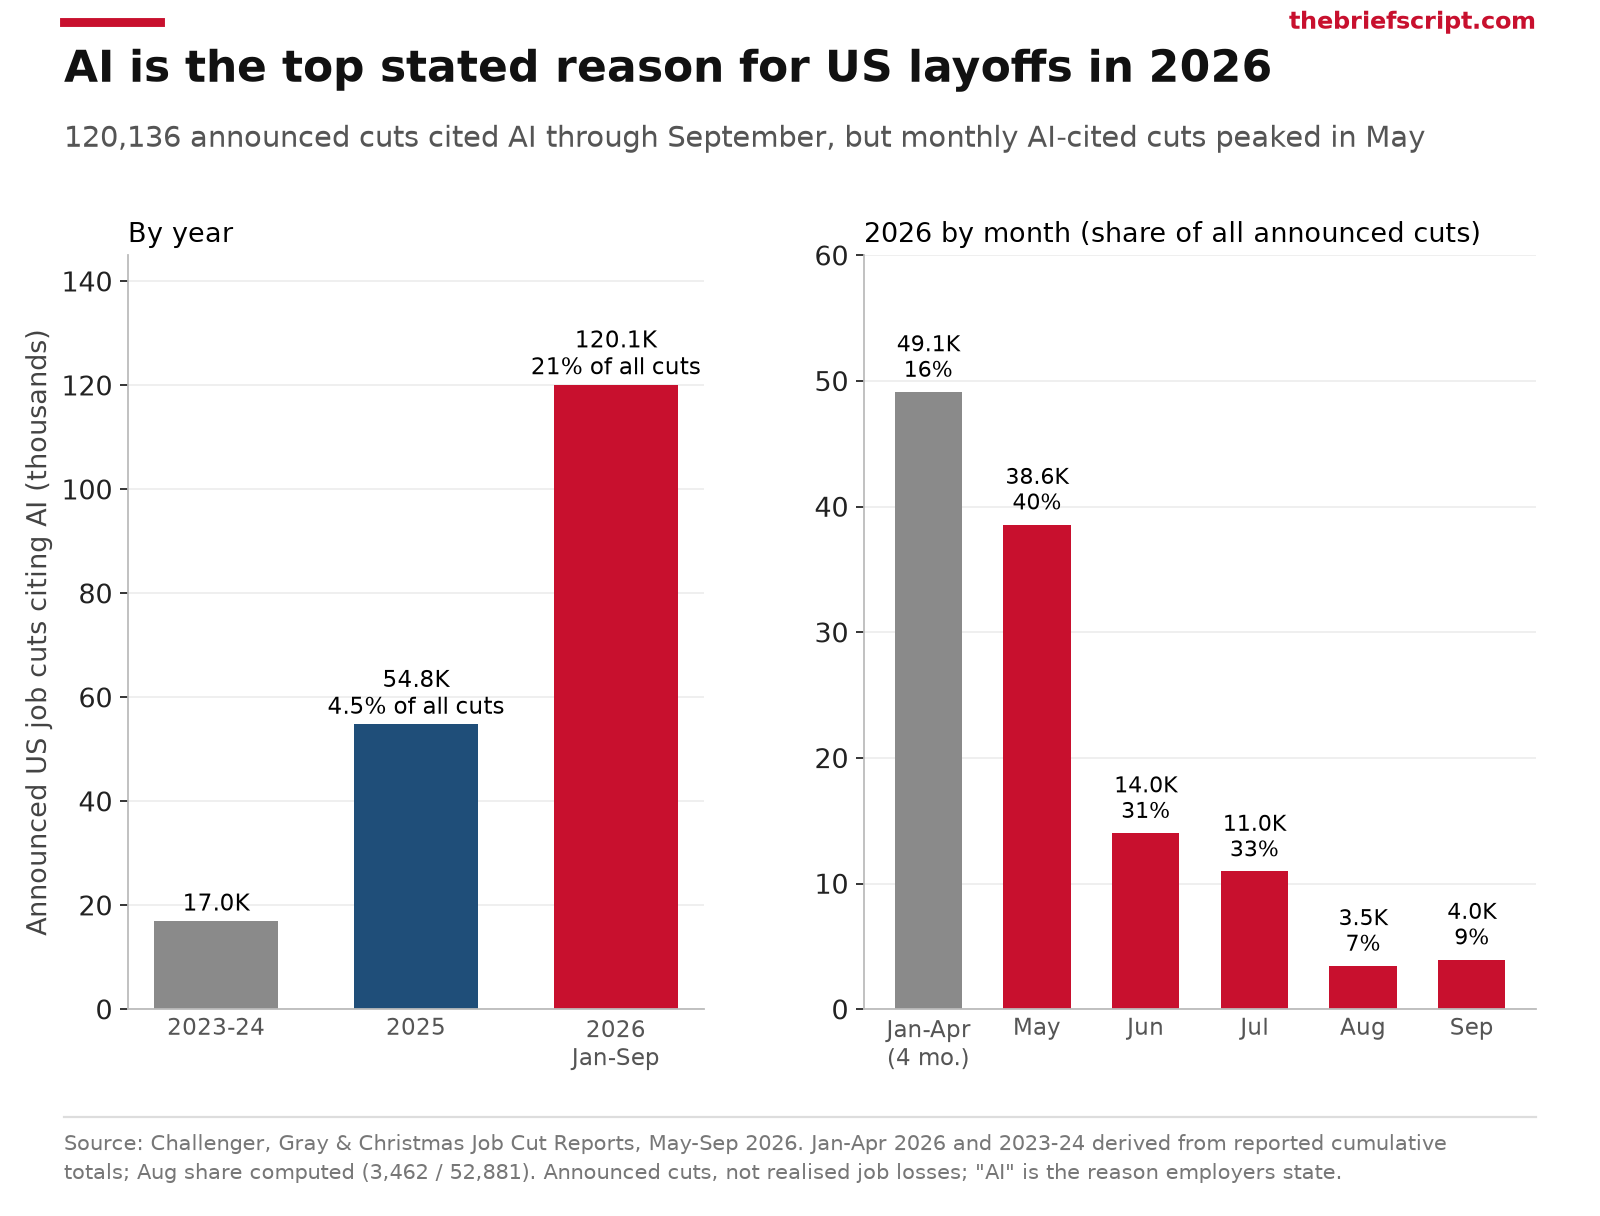
- 2026, January to September: 120,136 announced US job cuts cited AI, about 21% of 573,195 total cuts. AI is the #1 stated reason year to date (Challenger September 2026 report).
- 2025 full year: 54,836 AI-cited cuts, 4.5% of 1,206,374. Challenger also logged 20,219 cuts under “Technological Update (possibly AI).”
- 2023–24 combined: 16,989, derived from Challenger’s cumulative totals.
- The monthly peak was May 2026: 38,579 AI-cited cuts, 40% of that month (Challenger May 2026). The count then fell: 14,029 in June, 10,970 in July, 3,462 in August and 3,961 in September (9%, the fifth-ranked reason).
- Technology companies announced 165,925 cuts in 2026 through September, 29% of all cuts.
Read these with care. They are announced cuts, not confirmed job losses. “AI” is the reason employers state, and Challenger itself notes the attribution is ambiguous. And Challenger reports by employer and industry, not by occupation, so these layoffs can’t be matched to our occupation scores. For scale, 120,136 cuts is less than 0.1% of the 154.6 million jobs in our data.
What this means: AI layoffs have moved from rounding error to the top stated reason in 2026, but they remain small next to the workforce, and they fell sharply after May. Watch the trend, not one month.
Will AI take my job? A five-question self-check
Your occupation’s score is an average across everyone in it. Your own job may be more or less exposed depending on what you actually spend your day doing. These five questions mirror what drives the index:
- How much of your day is reading, writing, summarizing, coding, analyzing or answering routine questions on a screen? This is what all three exposure measures pick up. If it’s most of your day, your tasks are highly exposed.
- How much of your work is physical? Lifting, handling tools and materials, moving around a site. Physical work is a big part of why trades and care jobs score as AI-proof: it keeps exposure low and counts toward human presence.
- Do you care for people, serve them face to face, or work physically close to them? Patients, clients, students, customers in the room. Human presence is 20% of the AI-Proof Score because generative AI can’t stand in for it.
- Are people in your role already using AI heavily? If colleagues use AI for core tasks, your job is in the “exposed and adopted” group, just 5% of workers but where change shows up first. If adoption is low despite high exposure, the change is probably delayed, not cancelled.
- Is demand for your occupation growing? Rising demand can absorb productivity gains. Jobs that are both highly exposed and shrinking, like data entry and telemarketing, carry the most risk.
Mostly “yes” to 1 and 4 and “no” to 2, 3 and 5? Your tasks are among the most exposed. That doesn’t mean your job will vanish. It means the people who keep these jobs will be the ones who use AI to take on the judgment, relationships and accountability it can’t. To find your occupation, download the full dataset and search by title or SOC code.
What this means for workers: Move toward the parts of your job AI can’t do: decisions, client relationships, hands-on work, sign-off responsibility. Learn the AI tools your field already uses, because in high-adoption jobs that’s becoming the baseline. If you’re in an exposed and shrinking occupation, the adjacent roles on our AI-proof list, especially in healthcare, are realistic moves.
What this means for employers: Use exposure to redesign work, not just cut headcount. The jobs where adoption already outruns theory, like programming, market research and sales, are where productivity gains are landing now. Our study of 150 enterprise AI agent deployments shows what works in practice, and the AI API Price Index tracks how fast the cost of automating a task is falling. Be precise in layoff messaging, too: “AI” is now the top stated reason for announced cuts and Challenger itself calls that attribution ambiguous.
The bottom line
The jobs most exposed to AI in 2026 aren’t the ones automation used to threaten. They’re well-paid, degree-requiring office, writing, data and computer jobs. The most AI-proof jobs are the ones that need a body in the room: roofers, therapists, aides, line workers, surgical staff.
About a quarter of US workers are in highly exposed jobs. Only 5% are in jobs where heavy AI use has already arrived, and real usage covers about 40% of what theory allows. The gap between those numbers is the adjustment still to come. We’ll update the index when new Anthropic Economic Index releases and BLS data land.
Methodology
Unit of analysis. The 830 detailed occupations in BLS OEWS May 2025 (2018 SOC, including OEWS aggregate codes such as 31-1120). An occupation needs at least two of the three exposure sources to be scored, which leaves 813 occupations and 154,608,040 workers (99.4% of 155,495,730 OEWS jobs). The 17 dropped are residual “All Other” codes without O*NET task data. The ranked top-25 lists also exclude the remaining 53 “All Other” codes and any occupation missing an exposure source, leaving 757 eligible. Ranks are out of all 813.
Data sources.
- Eloundou, Manning, Mishkin & Rock, “GPTs are GPTs” (OpenAI/UPenn, 2023):
data/occ_level.csvfrom github.com/openai/GPTs-are-GPTs. β exposure (share of tasks an LLM, alone or with tools, can do at least twice as fast), mean of the human and GPT-4 raters. - Microsoft Research, “Working with AI” (Tomlinson et al.), v1.1: AI applicability score from US Bing Copilot conversations (January to September 2024) and physical-task share. github.com/microsoft/working-with-ai.
- Felten, Raj & Seamans AIOE: Language-Modeling AIOE (2023), 2010 SOC, crosswalked to 2018 SOC. github.com/AIOE-Data/AIOE.
- Anthropic Economic Index, release 2026-06-26: global Claude.ai and first-party API usage shares by occupation, April and May 2026, plus automation and augmentation shares. huggingface.co/datasets/Anthropic/EconomicIndex.
- Anthropic, “Labor market impacts of AI” (Massenkoff & McCrory, March 5, 2026): observed exposure for 756 occupations (share of time-weighted tasks covered by work use of Claude; automation counted fully, augmentation half). anthropic.com/research/labor-market-impacts.
- BLS Occupational Employment and Wage Statistics, May 2025 (national, cross-industry): employment and median annual wage. bls.gov/oes.
- BLS Employment Projections 2025–35 (Table 1.2): projected percent change, change in jobs, typical entry education. bls.gov/emp.
- O*NET 31.0: Job Zone; work activities (Performing General Physical Activities, Handling and Moving Objects, Assisting and Caring for Others, Performing for or Working Directly with the Public); work context (Physical Proximity). onetcenter.org.
- Crosswalks: BLS SOC 2010→2018 crosswalk and SOC 2018 structure (bls.gov/soc/2018). O*NET-SOC codes are truncated to six-digit SOC; several O*NET codes under one SOC are averaged.
- Challenger, Gray & Christmas monthly Job Cut Reports, May to September 2026 (context only, not used in any score): June, July, August and September, plus the May release linked above.
Formulas.
z(x) is x standardized across the 813 occupations (mean 0, SD 1); mm(x) rescales to 0–100.
- AI Exposure Score = mm(E), where E = mean of z(Eloundou β), z(Microsoft applicability) and z(Felten LM-AIOE), equal weights of 1/3 over the sources available.
- AI Adoption Signal = mm(0.50·z(observed exposure) + 0.25·z(log Claude.ai intensity) + 0.25·z(log API intensity)). Intensity is an occupation’s share of Claude usage divided by its share of US employment.
- AI-Proof Score = mm(0.60·(−z(E)) + 0.20·z(G) + 0.20·z(H)). G is BLS projected growth 2025–35, winsorized at the 2.5th and 97.5th percentiles (−15.4% and +17.4%). H is human presence: half physical intensity (Microsoft physical-task share, O*NET general physical activity, O*NET handling objects) and half interpersonal intensity (O*NET caring for others, working with the public, physical proximity).
- High exposure = AI Exposure Score of 60 or more. Theory vs. usage gap = residual from a regression of z(adoption) on z(exposure) (slope 0.73), reported for occupations with 10,000+ workers.
Missing values. Where a source has no exact match for an OEWS code, we use the mean of that source’s detailed codes in the same SOC broad group, and flag it. Between 30 and 52 occupations per source are filled this way. 117 occupations have no published Anthropic usage (below Anthropic’s privacy thresholds) and are treated as zero usage. Five hourly-only occupations (actors, dancers, musicians and others) get an annual wage of hourly median × 2,080 and are excluded from the well-paid list.
Robustness.
- The sources agree. Rank correlations: Eloundou vs Felten 0.86, Eloundou vs Microsoft 0.75, Microsoft vs Felten 0.71. Anthropic’s observed exposure correlates 0.58 to 0.70 with the three theoretical measures.
- AI Exposure Score under 10 alternatives (three 50/25/25 reweightings, leaving out each source, adding observed exposure as a fourth source, swapping in the all-AI AIOE, and human-only or GPT-4-only ratings): rank correlation with the baseline 0.971 to 0.997; 15 to 23 of the top 25 unchanged.
- AI-Proof Score under 17 alternatives (component weights of 50/25/25, 70/15/15 and 80/10/10; no growth; no human presence; adding adoption; every exposure variant): rank correlation 0.959 to 0.998; 11 to 24 of the top 25 unchanged. The exposure-only ranking is the outlier (0.919), which shows growth and human presence change which low-exposure jobs make the top 25, not the overall order.
Limitations.
- Exposure is not job loss. None of the measures captures employer decisions, demand, new tasks or regulation. AI that helps a worker can raise demand for the job.
- Adoption is Claude-only and skews toward technical users. It doesn’t include ChatGPT, Gemini or Copilot use, and it includes some personal and coursework conversations. AEI usage shares are global; employment, wages and projections are US.
- Different vintages. The exposure sources rate 2023–2024 capabilities; usage is from late 2025 and April to May 2026. Exposure is probably understated for 2026’s agentic tools.
- Occupation averages hide differences by seniority, employer and specialty, and median wages hide pay spread.
- Mapping artifacts. Anthropic maps conversations to tasks and then to occupations, so some jobs (librarians, counter clerks) get large usage shares through generic tasks. We log usage to limit outliers.
- BLS projections include the BLS’s own judgment, partly about AI, and growth is an input to the AI-Proof Score.
- Coverage gaps. Military occupations and self-employed workers aren’t in OEWS.
- Scores are relative. 0 and 100 mark the extremes of this dataset, not absolute levels of risk.
- Layoff figures are employer announcements, unverified, and not broken out by occupation.
Download the data
Free to reuse with attribution (CC-BY 4.0; source datasets keep their own licenses).
- briefscript_ai_proof_jobs_index_2026.csv: all 813 occupations with SOC code, AI-Proof Score, AI Exposure Score, AI Adoption Signal, ranks, employment and median wage (BLS OEWS May 2025), BLS projected growth 2025–35, major group and typical entry education.
Cite this report: The Brief Script, “AI-Proof Jobs Index 2026,” October 2026. thebriefscript.com/ai-proof-jobs/
FAQ
What jobs are AI-proof in 2026? By our AI-Proof Score, the top five are physical therapist assistants, massage therapists, roofers, orderlies, and home health and personal care aides. Hands-on healthcare and skilled trades dominate the top 25. Among better-paid options, power-line installers, dental hygienists, physician assistants and nurse practitioners score well.
What jobs will AI replace? No dataset can say which jobs will disappear. Ours shows where AI can do the most tasks: interpreters and translators, writers and authors, telemarketers, mathematicians, proofreaders, customer service representatives and PR specialists top the list. Jobs that are both highly exposed and already shrinking, such as data entry keyers, telemarketers and word processors, carry the most risk.
Will AI take my job? Probably not outright, but it may change it a lot. Check how much of your day is screen-based language or data work, how physical and people-facing your job is, whether colleagues already use AI heavily, and whether demand for your role is growing. Use the self-check above and look up your occupation in our dataset.
How many jobs are exposed to AI? 38.4 million US workers (24.8%) are in jobs with an AI Exposure Score of 60 or more. Depending on the threshold, the figure ranges from 4.9 million to 62.1 million. Only 7.8 million (5.0%) are in jobs that are both highly exposed and already heavily using AI.
How many AI layoffs have there been in 2026? Challenger, Gray & Christmas counted 120,136 announced US job cuts citing AI from January to September 2026, about 21% of all announced cuts and the top stated reason. Monthly AI-cited cuts peaked in May at 38,579 and fell to 3,961 in September. These are announcements, not confirmed losses.
Is any job completely AI-proof? No. Every occupation has some tasks AI can help with, and robots are a separate risk for some physical jobs, which is one reason some low-exposure production jobs are still projected to shrink. “AI-proof” here means the lowest exposure to generative AI combined with growing demand and work that needs a person present.